Background
As we have previously written, for all Suricata’s capabilities, building out an enterprise-scale deployment of Suricata with mostly open source tools can be a challenge.
In this fourth entry in the series of blog posts, we review another one of the five ways to improve the scalability of Suricata in an enterprise deployment - Consolidating Suricata Alerts and Logs.
Note: for a more complete review of all five improvements, please check out the white paper, Scaling Suricata for Enterprise Deployment. You can download your copy here >>
Consolidating the Suricata Alerts and Logs
A single instance of Suricata deployed as a SELKS installation provides you with a turnkey Suricata intrusion detection and prevention system and NSM platform with the ELK stack to collect, store, and analyze alerts and events, EveBox to correlate flows, archive/comment on events, reporting and pcap download. The SELKS user interface is the Scirius Community Edition which allows an analyst to perform basic incident investigation and basic threat hunting (along with configuration and management of the Suricata ruleset).
But enterprises deploying multiple sensors must find a way to consolidate the logs, events and alerts from those sensors into a “single pane of glass” to efficiently correlate, analyze, search, and gain insights into their overall enterprise network security posture.

Figure 1. Consolidate logs, events and alerts from Suricata sensors to simplify the SOC
This is the function typically provided by a security information and event management system (SIEM), a software system that analyzes log and event data in real time to provide threat monitoring, event correlation and incident response.
The good news is that there are a number of free and open source options to choose from. Three examples of this genre are listed below.
- ELK stack - also known as “ELK”, this set of tools is built and maintained by Elastic and includes Elasticsearch the JSON-based search and analytics engine; Logstash data collection pipeline; and Kibana for visualizations. Note: there is a free set of Suricata dashboards available here.
- OSIM - offered by AlientVault (now AT&T), this SIEM offers event collection, normalization, and correlation functionality. It also includes basic logging and monitoring, threat assessment and some automated response, data analysis, and data archiving tools.
- SIEMonster - an integrated collection of the best open source security tools, as well as some custom development that includes incident reporting, advanced correlation with threat intelligence and active response.
Naturally, the challenges of these open source tools is that no single one of these is capable of solving all your organization’s needs, so you may find yourself augmenting your selection with other open source or commercial tools to get the coverage you need.
Ideally, the network security information detected, collected and logged by the Suricata sensors is combined with other indicators generated by systems such as endpoint detection systems. But at a minimum, all events from Suricata sensors should be consolidated into a single console.
Of course, many commercial options are also available. These tend to be more full-featured and newer offerings include functionality such as advanced analytics, threat intelligence, incident response and user monitoring.
One of the most popular commercial options is Splunk, an open platform for which many security vendors have developed custom apps to optimize their system’s integration into the platform. This particular one bears mentioning in this paper because of the recently introduced Stamus Networks App for Splunk which includes native support for Suricata.
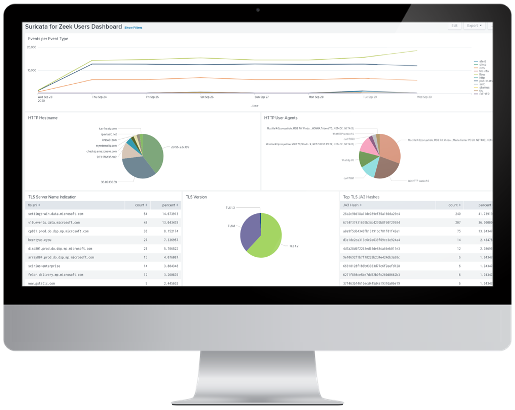
Figure 2. Stamus Networks App for Splunk delivers native support for Suricata in Spunk.
The Stamus Networks App for Splunk allows Splunk Enterprise users to extract information and insights from Suricata sensors. It provides ready-to-use dashboards and reports that expose the IDS and NSM data being collected by Suricata sensors and help those with large Suricata deployments become more productive.
Other Articles in the Series on Scaling Suricata
In an earlier blog article we reviewed ways to optimize your sensor placement. Future blog articles will cover the additional three considerations that can help you improve the scalability of Suricata in your enterprise. Here’s the complete list of articles:
- Optimizing sensor placement
- Deploying centralized sensor management
- Tune the network of sensors for maximum performance
- Consolidate Suricata alerts and logs from multiple sensors (this article)
- Leveraging high-level analytics to focus analysts’ time on the the things that matter
Additional Suricata Resources
If you are interested in exploring this topic further, we recommend the following resources:
- Suricata website
- OISF website
- SELKS web page
- SELKS github page
- Just released: Suricata 6 (blog article)
- Suricata dashboards for any ELK stack (open source contribution by Stamus Networks)
- Grafana dashboards for SELKS (open source contribution)
- Suricata user forum
- Strategic Sensor Placement for Intrusion Detection in Network-Based IDS (academic paper)
- Suricata Extreme Performance Tuning (SEPTun) guide - Part 1
- Suricata Extreme Performance Tuning guide - Mark II
- Official Suricata training resources
- Comparing SELKS and Scirius Security Platform (white paper)
- 11 Open Source SIEM Tools (article)
- Splunk enterprise security solutions
- Introducing the Stamus Networks App for Splunk (blog article)
- Stamus Security Platform(web page)