<img height="1" width="1" style="display:none;" alt="" src="https://px.ads.linkedin.com/collect/?pid=2180921&amp;fmt=gif">

An example: the SN-Hunt-1 dashboard

The most popular Kibana Dashboard in SELKS is the SN-Hunt-1 dashboard, which is specifically developed for Incident response or threat hunting. It is most useful for IP/host investigation and malware case review through PCAP ingestion.


The SN-Hunt-1 dashboard can provide an overview of pcap file content, including application protocols, source and destination IPs, and related network protocol and flow data broken down in interesting metadata visualizations that populate depending on the data reviewed. It also includes really helpful visualizations that are designed to help analysts quickly pivot to identify potentially malicious activity and investigate it further.

Kibana

Visualizations:

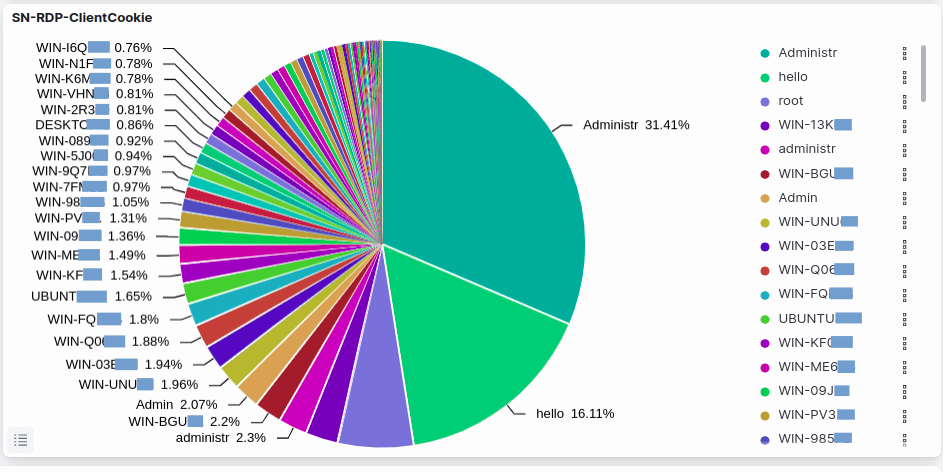
  • SN-RDP-ClientCookie pie chart
  • SN-Mean flow age and count graph
  • SN-Application protocol graph
  • SN-EventsList tables
  • SN-TLS-BySni graph
  • SN-ANOMALY-ByAppProto graph
  • SN-FILE-ByTypeOverTime graph
  • SN-SMB-NtlmsspHost pie chart
  • SN-ALL-EventsList table
  • And many more…

Join the Community Discussion

Have questions or comments about the Kibana Dashboards project?
Interested in contributing to the code or knowledge base?


Open your pull request on the project's GitHub repository.
Or join the discussion on our Discord server.

Request a Demo
DATASHEET

Additional Resources

Stamus-SELKS-Kibana-SN-Hunt-1-v4

Analyzing Network Traffic with Kibana in SELKS: the SN-Hunt-1 Dashboard - Part 1

Read More
Stamus-SELKS-Kibana-SN-Hunt-1-v4

Analyzing Network Traffic with Kibana in SELKS: the SN-Hunt-1 Dashboard - Part 2

Read More
Stamus-SELKS-Kibana-SN-Hunt-1-v4

Analyzing Network Traffic with Kibana Dashboards in SELKS: the SN-Hunt-1 Dashboard - Part 3

Read More
Wireshark-pt1-SELKS-for-Quiz-B

Use SELKS to solve the Unit 42 Wireshark Quiz

Read More