In this week’s guided threat hunting blog, we focus on using Clear NDR to identify rogue proxy servers. Depending on the organization’s network set-up, questions often arise regarding the use of proxy servers. Specifically, whether users within the organization are using approved proxy servers or routing traffic through a rogue, unauthorized, or previously unseen proxy service. This week’s guided filter can identify not only a list of proxies seen on the network, but also any that are unfamiliar or unapproved and any rogue proxies which might have malicious intent.
Clear NDR automatically detects and identifies threats on the network, and presents security teams with incident timelines and extensive context for each threat. Many organizations take advantage of advanced Clear NDR features and take an even more proactive approach to their defenses. When this is the case, they might task a security analyst with hunting for specific threat types, anomalous activity, or suspicious behaviors. To do this, they can use the Stamus Enriched Hunting Interface.
This interface provides security practitioners with over 100 ready-to-use guided threat hunting filters, including various filters for policy violations, that they can use to investigate, classify, escalate, and automate vast amounts of event data, alerts, and contextual metadata. For a more detailed look at the Enriched Hunting Interface, read the blog article entitled, “Introduction to Guided Threat Hunting”.
What are rogue proxy servers?
Proxy servers act as an intermediary between a client’s requests and the server that provides those resources. See illustration below.
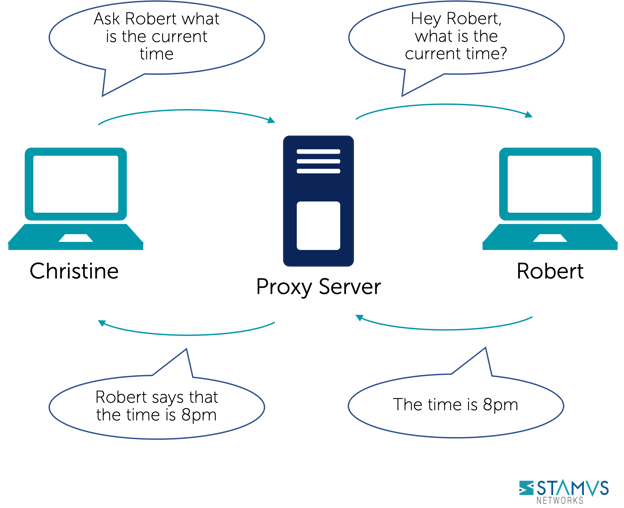
Source: Concept borrowed from wikipedia (https://en.wikipedia.org/wiki/Proxy_server)
Typically used as a security measure, the proxy server is set up by an organization’s IT team. It receives all the requests that are sent by users’ clients and then checks to see if those requests fit within the organization’s set policies. If the request is approved, then it is sent from the proxy’s IP address to the requested server, and then communicates the resources back to the client. If a request is denied, then the client is redirected elsewhere.
Sometimes, users install proxies that have not been approved by the organization. This could be a completely rogue proxy that has been set up to intercept traffic, or it could be a reverse proxy that is guarding the requested server.
Not every unfamiliar, unapproved proxy server is inherently malicious, but it is still important for security teams to identify these previously unseen proxies in the event that there is malicious intent behind them. These unknown proxies are what we call “rogue proxy servers”, and Clear NDR’s Enriched Hunting Interface provides the means for Clear NDR users to identify them on their organization’s network.
Identifying serving proxies using Clear NDR
The enriched hunting interface provides a filter that guides hunters to find this exact type of activity within their organization’s infrastructure using insights gathered from the network.
Let’s take a look at an example:
In the past 48 hrs, we have had about 8.7 million alerts alert events which have triggered hundreds of thousands of results.

The Hunt for Rogue Proxy Servers
To begin this hunt, we first select the relevant filter from the drop down list. Since there are over 100 guided hunting filters, we need to narrow the list down and find the filter we want. To do this, we can search for “proxy” or “proxies” and then select the filter. In this example, we select the filter titled, “Roles: Detected HTTP(S) Proxies and HTTP(S) Proxy Services”.

Selecting this filter narrows our events from 8.7 million down to 492 alert instances of HTTP(S) Proxies and proxy services seen on the network.

To help us narrow this down even further for a more thorough investigation, we need review the list of affected hosts. To do this, we need to switch to the Hosts tab in the Stamus Enriched Hunting interface. Switching to this tab returns a result of 7 foreign/outside proxies.

Clear NDR’s Enriched Hunting Interface provides us with additional organization-specific context. We can filter for data from various departments or user groups within the organization, allowing them to hyper-focus on specific areas without having to aggregate events or organize IP addresses to find specific users or departments.
In this instance, we want to see regular users within this group of affected hosts. To do that we just have to set a quick filter, and then my result of 3 outside proxies is displayed.


Evidence for Incident Response
With just a few clicks, We are able to view two important sets of evidence:
- The associated network protocol transactions and flow logs
- Host Insights – a single screen for reviewing 60+ network activity attributes collected for every host
The events are already enriched by Clear NDR to include important metadata like DNS records, TLS protocol data containing certificate names, fingerprint JA3/JA3S, connection flow sizes, http user agent, http host, request body, status codes, file transaction info, and more.
We also want to see if any of these proxies are using specific TLS certificates. In this case, we are interested in seeing what proxies have been seen using Let’s Encrypt issued certificates (because they are not used by the organization’s traditional proxies). We would also like to know which clients were first seen using it.

The addition of the “Services: Let’s Encrypt issued certificates” filter reduces the results to one single proxy.

Let’s quickly review the condensed communication fingerprint matrix information for that host.
To do this, we can use Host Insights – a very powerful feature included with the Clear NDR. Host Insights tracks over 60 security-related network transactions and communication attributes of every host seen on the network. This provides a single place to view many aspects of the network activity relative to a given host, such as network services, users, or TLS fingerprinting forensic evidence.
It’s important to know who the client and offending hosts are and if there is additional information about those seen on the network. Specifically, we need to see which services are running on the offender’s host.

Now we need to know which clients used those proxies first and further investigate the evidence. We can do that by using a unique Clear NDR feature called “Sightings”. It has a simple, yet powerful and potent purpose - highlighting communications on my network that are new and have never been seen before. To see when clients first used those proxies, we simply switch off the alert events and leave “Sightings” on.


Security analysts can use any piece of metadata to create simple or complex filters using wildcard, negation, or inclusion operations. You can even include multiple fields for fast drill down capabilities. All domains, TLS SNI, IP addresses, HTTP hosts, and more can easily be checked with an external threat intelligence provider such as Virus Total.
We can switch to our Dashboards tab and see exactly what those new SNIs are:

From here, we can select a specific event and further review the supplemented network protocol and connection logs evidence. This information not only provides context for our current hunt, but also allows us to use the available metadata to create other hunting filters for future use.


Now, among other protocol evidence, we are also aware of the offending certificate fingerprint and issuer. We can select exactly those and review who else used them.

Armed with all of the above information and evidence, the hunter has enough information to generate an incident response (IR) ticket.
However, there are still two tasks left to complete:
- 1. We do not want to repeat this exact same process again in the future, so we need to set up classification and auto-escalation for future occurrences.
- 2. And, if anything like this has happened before, we want to find it among the historical data and escalate it with all the associated evidence.
Classification
In order to streamline the event review/triage process in the future, an experienced analyst can choose to tag/classify the events associated with this filter After doing so, SSP will tag future events that match the filter criteria as “relevant” or “informational,” depending upon the analyst’s selection. These tags can be used to automate event review/triage and make it easier for a less-experienced analyst to focus only on the events that are relevant for manual review.
To do so, the analyst selects the Tag option from the Policy Action menu on the right hand side menu. This action will cause SSP to insert a tag into each event record as shown below:

This allows the analyst to easily filter out or search for them in any SIEM (Chronicle, Splunk, Elasticsearch, etc) or data lake by using that tag in the query.
It also allows for easy filtering out of those events in the Stamus Enriched Hunting GUI by switching to “relevant” only classified events.

Escalation and Automation of this Hunt
To set up an automation which causes SSP to escalate past and future occurrences, we can create a Declaration of Compromise (DoC) event from the Policy Actions drop down menu on the right hand side panel in the Stamus Enriched Hunting Interface.

For each DoC policy that we create, we add an explanation about the type of threat. This gives us a chance to provide informational context and helps convey knowledge to colleagues

We may also select the option to generate events from historical data and/or generate Webhook notifications.

Just like that, the hunt and collection of all related activities are complete. Any past or future generated events matching this DoC criteria will be auto-classified and will trigger the desired response process – via webhook to a SOAR playbook, chat notification, or incident response ticket.
Conclusion
The post-hunt activities completed in this example are just the tip of the iceberg when it comes to the automation and escalation capabilities of Clear NDR. To learn more about these features and how to implement them, read our article titled “After the Hunt”.
To learn more about Network Detection and Response (NDR) from Stamus Networks and see the enriched hunting interface for yourself, click the button below and schedule a live demo.