Earlier this week, we introduced the second set of visualizations provided by the SN-Hunt-1 Kibana dashboard in SELKS. This week, we will continue with part 3 of our series on Kibana dashboards in SELKS and walk through the rest of the tables and graphs in the SN-Hunt-1 dashboard that can be useful for analyzing network traffic using SELKS. To see the first six visualizations, you can review the first part of the series here.
Keeping your network secure can feel like an endless game of cat and mouse. But with SELKS and its powerful Kibana dashboards and GUI utilizing the Suricata alert and protocol data, you can stay one step ahead of potential threats. As security threats become increasingly sophisticated, it's crucial to have the right tools to monitor your network traffic. This is where the Open Source SELKS predefined dashboards come in. In this blog post, we'll show you one of those 28 Open Source dashboards. The SN-Hunt-1 Kibana dashboard in SELKS can provide valuable insights into your network traffic and help you detect potential threats. For a closer look at SELKS, read “SELKS 7: An Introduction” , “Inside SELKS: What’s Under the Hood” or Spin up a Complete Suricata Network Security Platform in Under 2 Minutes.
Visualizing Network Security Threats: An Overview of the Information Provided by the SN-Hunt-1 Dashboard in SELKS Kibana
The SN-Hunt-1 dashboard is specifically developed for Incident response or threat hunting. It is most useful in two cases. The first case – IP/ host investigation – is done by typing in the IP that we want to investigate. The second case is for review of specific malware cases by way of ingesting a pcap.
Let’s review that second use case.
The SN-Hunt-1 dashboard can provide an overview of pcap file content, including application protocols, source and destination IPs, and related network protocol and flow data broken down in interesting metadata visualizations that populate depending on the data reviewed. It also includes really helpful visualizations that are designed to help analysts quickly pivot to identify potentially malicious activity and investigate it further.
To see the SN-Hunt-1 Kibana dashboard in action, read “Use SELKS Kibana Dashbaords to Solve the Unit 42 Wireshark Quiz”.
As always, we want to give a special thanks to Malware Traffic Analysis for providing the public pcap data that we use to explain some of the visualizations in these blog posts.
Today, we will be reviewing the following visualizations provided by the SN-Hunt-1 dashboard:
- SN-SMB-NtlmsspHost pie chart
- SN-RDP-ClientCookie pie chart
- SN-SMB-NtlmsspUser pie chart
- SSH-ByClientSoftwareVersion and SSH-ByServerSoftwareVersion pie charts
- SN-ALL-EventsList table
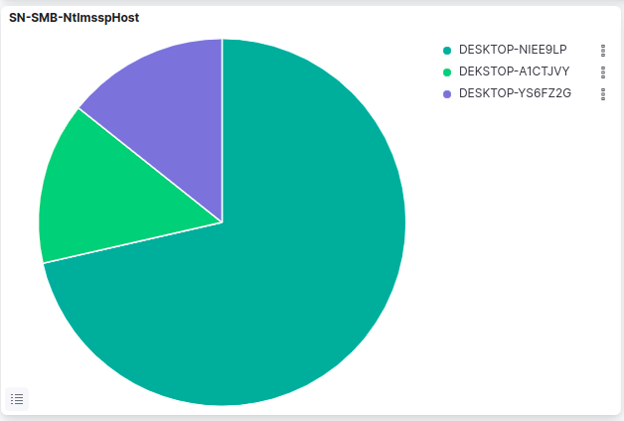
SN-SMB-NtlmsspHost
The SN-SMB-NtlmsspHost pie chart represents activity related to the Server Message Block (SMB) protocol, specifically authentication attempts from the perspective of the server or host. When a client attempts to access a resource on a remote server using SMB, the server will require the client to provide their credentials. If the server and client support NTLM authentication, the client's credentials will be hashed and sent to the server for verification.
The pie chart shows the hostname attempting to authenticate. This type of visualization is useful for identifying potential security threats related to SMB and NTLM authentication, such as attempts to exploit vulnerabilities in the authentication process or gain unauthorized access to resources on a network. Also NTLMSSP is used when Kerberos can't be used or in some other special cases - so the visualization helps bring observability to those events too.
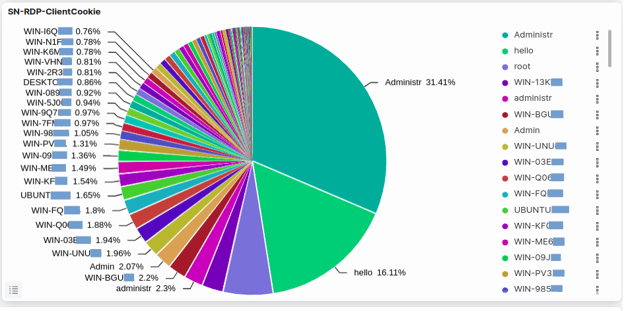
SN-RDP-ClientCookie
The SN-RDP-ClientCookie pie chart represents the RDP client cookies that have been detected in network traffic by Suricata. When a client establishes an RDP connection to a server, a unique session cookie is generated and used to maintain the connection. The SN-RDP-ClientCookie visualization shows the frequency of each client cookie detected in the network traffic, allowing analysts to see which RDP sessions are being used most often in the network.
This information can be useful for security analysts to identify potential security risks, such as unauthorized RDP connections or attempts to hijack active RDP sessions. By monitoring RDP client cookies, security analysts can detect anomalies in RDP traffic and investigate potential security incidents.
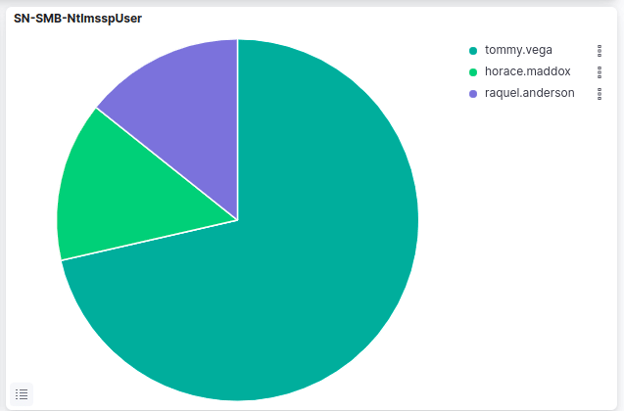
SN-SMB-NtlmsspUser
The SN-SMB-NtlmsspUser pie chart represents activity related to the Server Message Block (SMB) protocol, specifically authentication attempts using the NT LAN Manager (NTLM) Security Support Provider (SSP) protocol. When a user attempts to access a resource on a remote server using SMB, the server will require from the user to provide their credentials. If the server and user support NTLM authentication, the user's credentials will be hashed and sent to the server for verification. This exchange of messages between the client and server during the NTLM authentication process is what is being represented in the visualization.
The visualization shows the username of the user attempting to authenticate. This type of visualization is useful for identifying potential security threats related to SMB and NTLM authentication, such as brute-force attacks or attempts to gain unauthorized access to resources on a network. By monitoring and analyzing this activity, network administrators can detect and respond to security incidents more effectively.
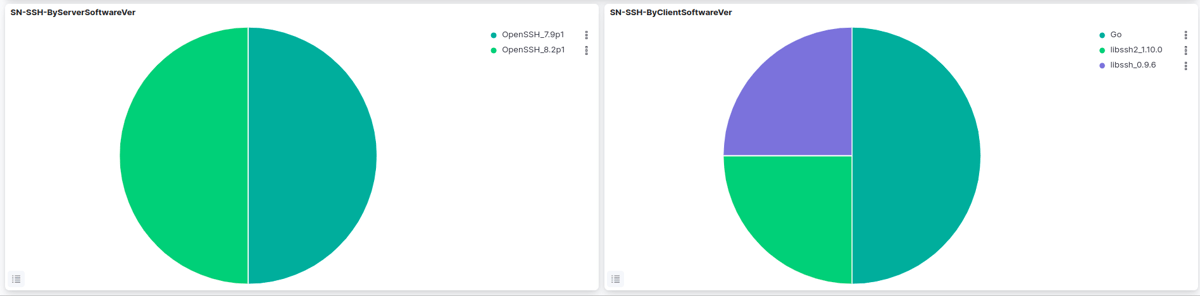
SSH-ByClientSoftwareVersion and SSH-ByServerSoftwareVersion pie charts
The SSH-ByClientSoftwareVersion and SSH-ByServerSoftwareVersion visualizations represent the distribution of SSH client and server software versions used for communication between the monitored SSH servers. Each slice of the pie chart represents a different version of the SSH server software, with the corresponding percentage indicating the proportion of monitored SSH servers that are running that version. In this case, the SSH-ByClientSoftwareVersion pie chart indicates that the majority of the monitored SSH servers are running either OpenSSH_8.2p1 or OpenSSH_7.9p.
The SN-SSHClientSoftwareVesrion pie chart represents the SSH client software versions that have been detected in network traffic by Suricata.Go, libssh2_1.10.0, and libssh_0.9.6 are the specific software versions that have been identified in the network traffic in our example below. This information can be useful for security analysts to identify which SSH client software versions are being used in the network and potentially identify any vulnerabilities or security risks associated with those versions.
Such information can be very useful for detecting anomalies and potential security issues. For example, if a particular version of an SSH client software has a known vulnerability, a high number of connections made with that version could indicate that an attacker is attempting to exploit the vulnerability. Conversely, if an SSH client software version is no longer supported or outdated, it could pose a security risk to the server and may need to be updated.
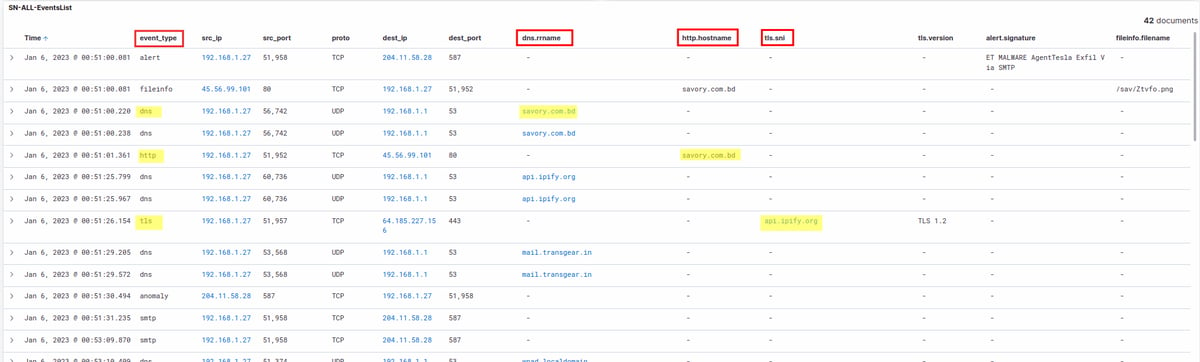
SN-ALL-EventsList table
The SN-ALL-EventsList table represents a table visualization of all the different event types produced by Suricata that have been collected and processed by the SELKS network security monitoring system. The purpose of this simple table is to display and make it easier to understand the sequence of events of a specific time slot in terms of network protocol logs, file transactions, and/or alert events generated. It helps investigate what malware does during incident response.
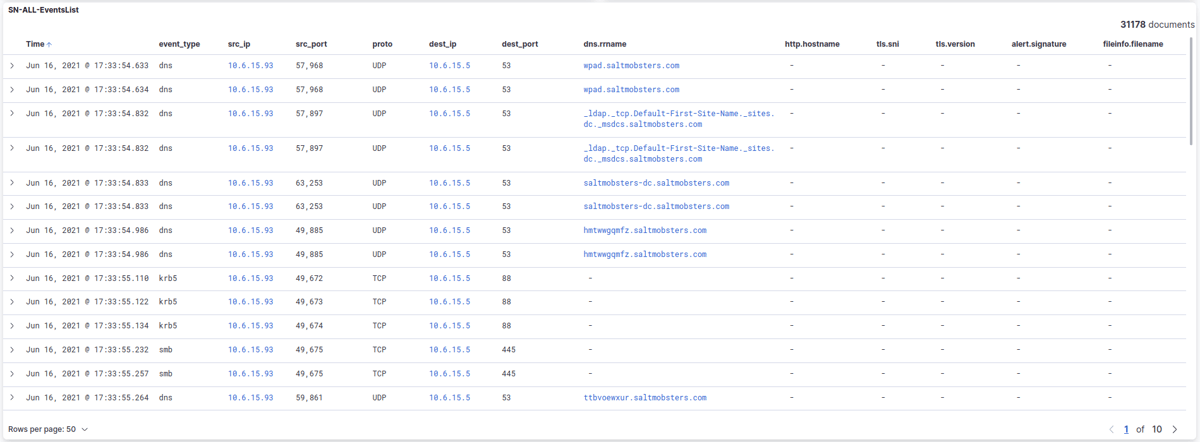
This section displays a list of all the events that have been generated by Suricata. Each row in the table represents a single event, and the columns display information such as the timestamp of the event, the source and destination IP addresses and ports, and the type of event that was detected. It usually includes the following information:
- Timestamp: The time and date that the event was detected by the SELKS system.
- Source IP Address: The IP address of the device that generated the network traffic.
- Source Port: The port number on the source device that was used for the network traffic.
- Destination IP Address: The IP address of the device that received the network traffic.
- Destination Port: The port number on the destination device that was used for the network traffic.
- Protocol: The protocol used for the network traffic, such as TCP, UDP, or ICMP.
- Event Type: The type of event that was detected by Suricata, such as a DNS, TLS, SMB, Fileinfo protocol transaction and others or an alert/anomaly event that may highlight an attempted malware infection, a suspicious network connection, or a potential vulnerability.
A note about event types: Suricata can generate various types of events depending on the type of network traffic and these event types are basically representative of the type of log. Additionally, Suricata natively delivers not just IDS/IPS detection and alerts, but also all the supporting evidence (actually regardless if there was an alert or not) offered by protocol transaction logs, flow records, full packet capture and extracted files. If you're interested, you can find more detailed information about the structure and output of the format of the event type logs here.
Some of the event types that are represented on the SN-ALL-EventsList table are:
- TLS events, for which we display the tls.sni – an extension to the TLS protocol that allows clients to indicate the hostname they are attempting to connect to during the TLS handshake process;
- DNS events, for which we display the dns.rrname – the domain name in a DNS resource record that specifies the domain name to which the record pertains;
- HTTP events, for which we display the http.hostname – the name of the server to which the client is sending the HTTP request;
You can click on the event type links and they will take you to a web page (like VirusTotal or abuse.ch) where you can check if that specific domain, sni, host, etc have been tagged as malicious - thus, making it easy to investigate.
The SN-ALL-EventsList section can be used by security analysts to investigate potential security incidents within the network, and to identify patterns or trends in the types of events that are being generated. Overall, the SN-ALL-EventsList section is an important tool for monitoring the security of a network and identifying potential threats or vulnerabilities that may require further investigation.
The SELKS Kibana SN-Hunt-1 Dashboard: A Valuable Network Traffic Analysis Tool
The SELKS Kibana SN-Hunt-1 dashboard can seem intimidating at first, but once you have mastered it it becomes an incredible tool for streamlining network traffic analysis and threat hunting. This dashboard provides a user-friendly interface that allows for easy navigation and analysis of network traffic data, making it easier to identify and troubleshoot issues. The powerful visualization tools and advanced filtering capabilities of the SELKS Kibana dashboard enables users to quickly identify patterns and anomalies in network traffic data, making it easier to recognize security threats and mitigate risks.
Overall, incorporating the SELKS Kibana SN-Hunt-1 dashboard into your network analysis toolkit can greatly enhance your ability to analyze network traffic data and solve complex network security challenges. To see the dashboard in action, make sure to subscribe to the Stamus Networks blog so you can be notified next week when we release a guide on how to solve the Unit 42 Wireshark quiz using only the SN-Hunt-1 Kibana dashboard in SELKS.