Believe it or not, you can launch a turnkey Suricata IDS/IPS/NSM installation – with as few as 4 commands on any Linux OS in the cloud or on your own hardware – and begin monitoring your network, investigating, and threat hunting with 400+ visualizations, 28+ dashboards, alerts, protocol transactions, and file extraction in under 2 minutes.
Yes, that is possible. Thanks to the new SELKS on Docker from Stamus Networks.
Why this matters
In recent years, cyber security threats have become an issue of epic proportions that can have dramatic consequences for organizations, individuals, and even entire governments. Stamus Networks knows very well the importance of this fact, and we take it very seriously.
And, while you can find a number of powerful commercial solutions on the market, many organizations simply cannot afford their up-front costs, some prefer to take a more hands-on role in experimenting with and customizing their solution, and still others are looking for a low-cost platform on which to teach threat hunting and cybersecurity basics. For those reasons, many organizations look to open-source security platforms. Unfortunately, many of the open source solutions - including network security platforms - require far-too much effort to set up and operate.
What every user and security analyst requires and desires from such a platform is reliability, quality, speed, ease of access. Simply put, they want something that works. And with SELKS on Docker, you can have all that in the matter of a couple of minutes.
Network Threat Detection from Ground Up
In cyber security teams, when someone hears the terms “network security monitoring,” “intrusion detection,” “network threat detection,” and considers a platform designed to do all these things, one imagines a complex system that is really difficult to install, configure, use, and maintain. And that is true to some extent, but thanks to Stamus Networks this does not have to be the case! With just a few commands, anyone can spin up their own system that incorporates all those above mentioned capabilities and start monitoring their network right away. Not only that, but all of that is publicly available as open source - for free!
A Little Background on SELKS
Developed by Stamus Networks, SELKS is a turnkey Suricata-based intrusion detection, intrusion prevention, and network security monitoring (IDS/IPS/NSM) system with its own graphical rule manager (Suricata Management) and basic threat hunting capabilities (Suricata Threat Hunting). SELKS is a Debian-based live distribution built from 5 key open source components that comprise its name – Suricata, Elasticsearch, Logstash, Kibana and Stamus Scirius Community Edition (Suricata Management and Suricata Hunting). In addition, it includes components from Arkime (formerly Moloch) and Evebox, which were added after the acronym was established. It is open source and publicly available on github.
With more than 400 different Kibana visualizations and 28+ dashboards, SELKS could become the next best friend of any cyber security analyst, whether experienced or not. Thanks to the Scirius interface, managing the whole platform becomes a piece of cake, and the Hunt interface is very intuitive and easy to learn. The recent implementation of SELKS on Docker (See https://www.stamus-networks.com/blog/selks-on-docker) now allows a user to spin up the whole system in a matter of minutes and start monitoring your network, detecting threats and hunting right away!
Because it's built on Docker, it always pulls the latest and greatest containers, including Evebox and Suricata. (Daily updated thanks to @jasonish).
System Requirements for SELKS on Docker
SELKS on Docker can run on any major Linux OS. Minimum system requirements includet 2 CPU’s and 8GB of RAM. If Docker is missing, the available easy-setup script can be used to install even that, too.
Let’s Spin up a SELKS Instance
Ok. So let’s spin up our very own SELKS instance and get ready to analyze a case from Malware traffic analysis (Big thanks to malware-traffic-analysis.net for their regular reports - to read more about the use case described in this article, visit https://www.malware-traffic-analysis.net/2021/09/17/index.html). At the end of this article you can find a one-line summary script of the whole sequence.
For our example, we will need to create a dummy network interface -- tppdummy0 -- to replay that pcap case file:
sudo ip link add tppdummy0 type dummy && sudo ip link set tppdummy0 up ; sudo ifconfig tppdummy0 mtu 1572
Let’s download SELKS Docker from the official Stamus Networks github repository.
git clone https://github.com/StamusNetworks/SELKS.git
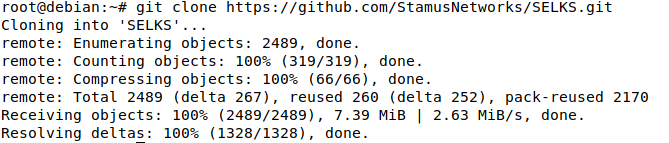
Figure 1. Cloning the SELKS github repository with 'git clone'
We can now spin up SELKS with a listening interface to be tppdummy0. Depending on our network connection and machine’s specs, the full system can be ready for real threat hunting, PCAP replay, investigation, or simply teaching in a matter of 2 minutes.
cd SELKS/docker
./easy-setup.sh --non-interactive -i tppdummy0 && docker-compose up -d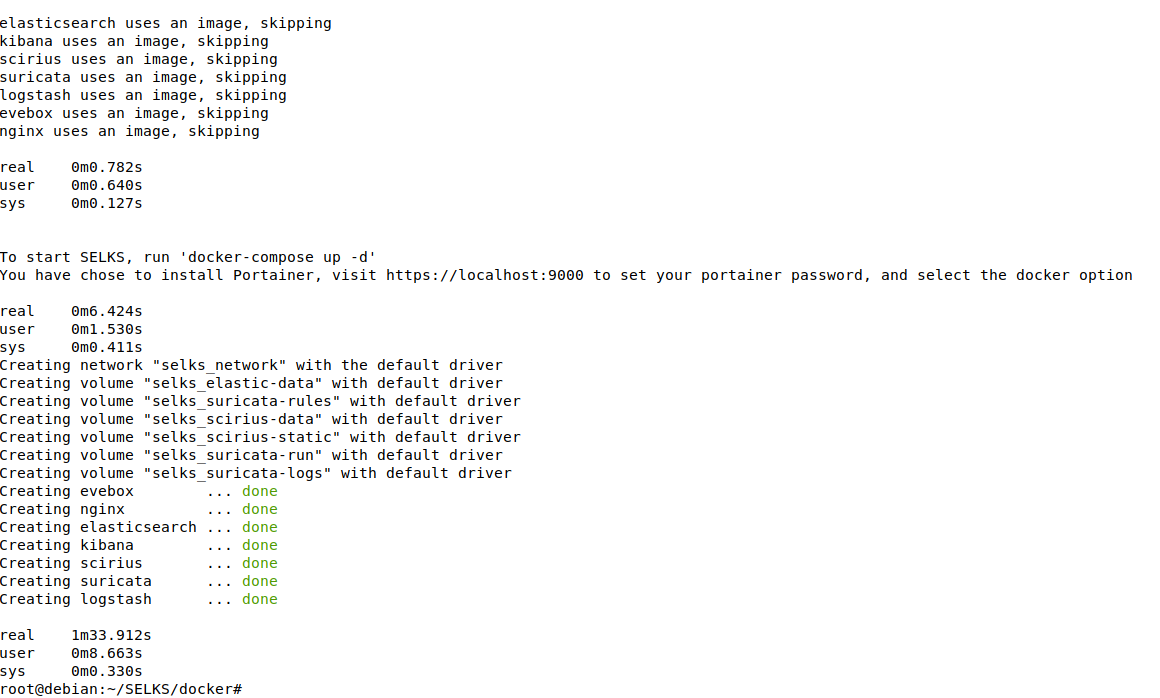
Figure 2. Sample output of ‘/easy-setup.sh’ and ‘docker-compose up -d’ commands
As seen above SELKS is up and running in exactly 1 minute and 33 seconds! Including pulling the Docker containers from the Internet. Of course, your actual time will depend on the connection at that moment. But nevertheless, it is pretty amazing to have everything live and working so fast with just a few commands and no additional configuration.
Let’s bring some action to SELKS and investigate a malicious PCAP case file now:
sudo tcpreplay-edit -i tppdummy0 --pps=5 --mtu-trunc 2021-09-17-Squirrelwaffle-loader-with-Cobalt-Strike.pcap
We have now SELKS running and available at https://localhost or you may point your browser to the IP address of the Docker container. Accept the self-signed certificate, and enter default username and password for “selks-user”. Then you may begin reviewing the data generated from the PCAP.
The screenshots that follow should give you examples of the powerful insights you can gather from the data presented by SELKS. These screenshots were captured from the open source Suricata Threat Hunting user interface developed by Stamus Networks
In this alert dashboard screenshot below (Figure 3), you can begin your hunt by building a filter from recent alerts or their associated metadata which is organized by data element, such as category, organizational information and protocol.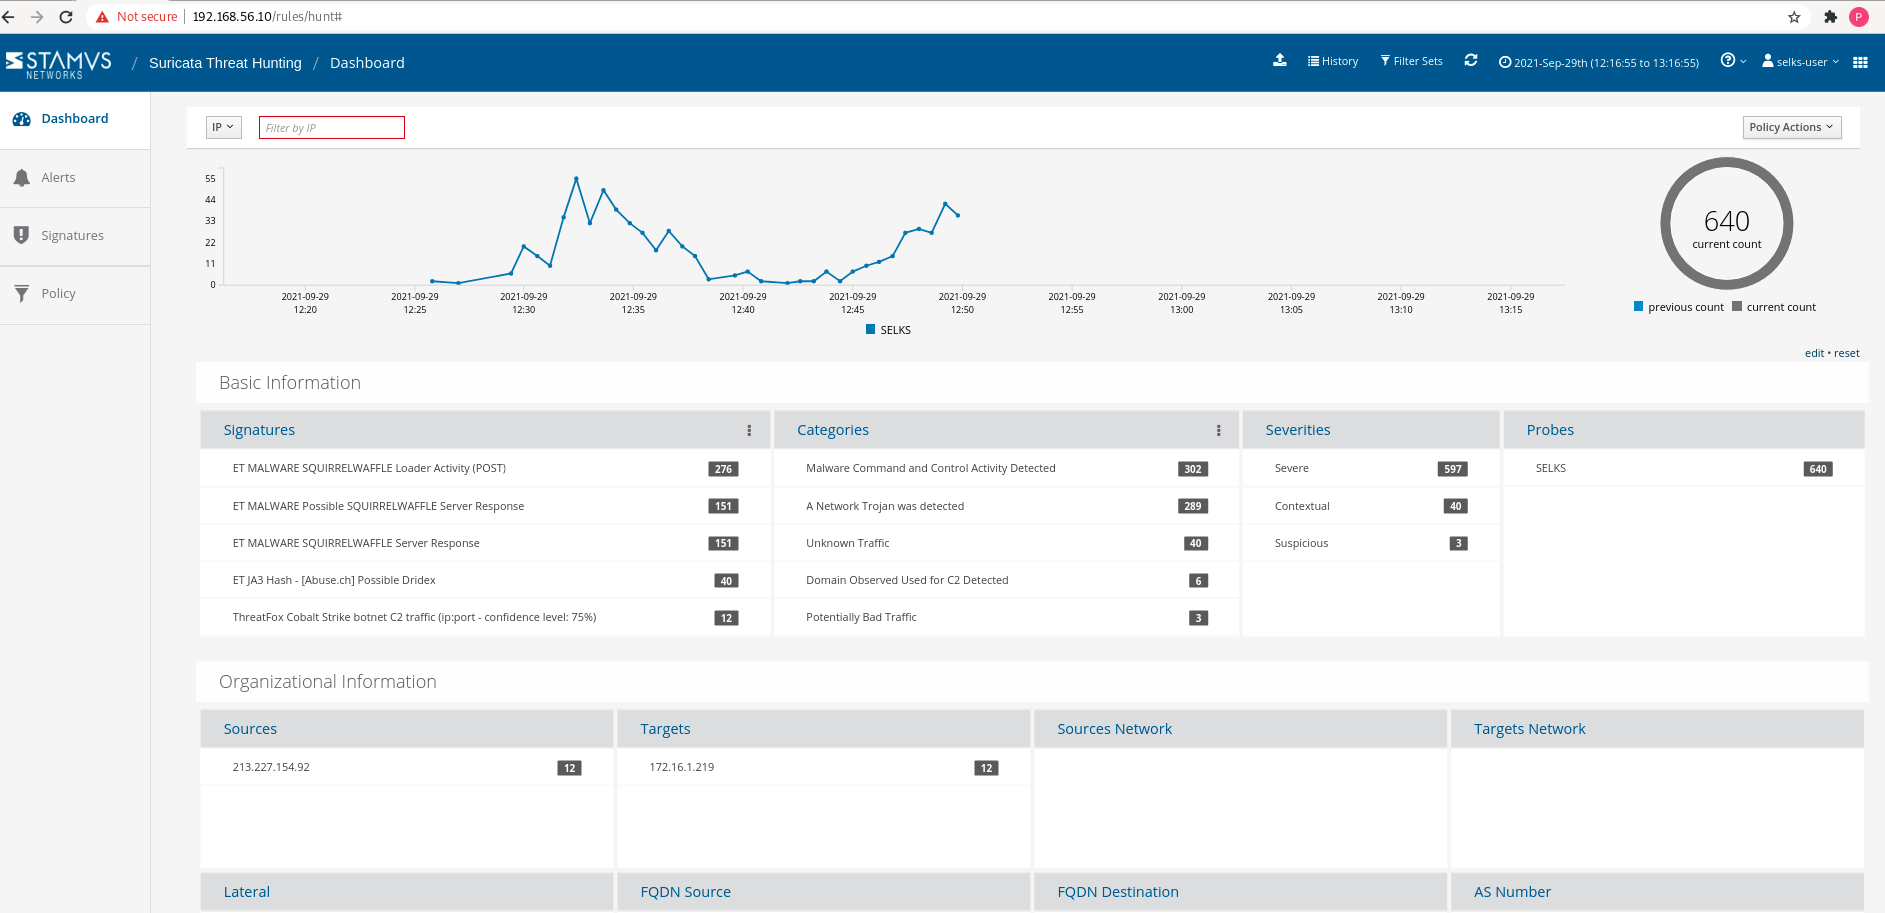
Figure 3. The Suricata Threat Hunting alert dashboard
In this next screenshot (Figure 4), you can see how the user can create hunting filters that allow you to isolate the results by simply clicking on the items in the dashboard. Note also on the right side of the screen: the system comes standard with a set of predefined filter sets designed to guide the user through a review of common issues, such as “suspicious HTTP user agents.”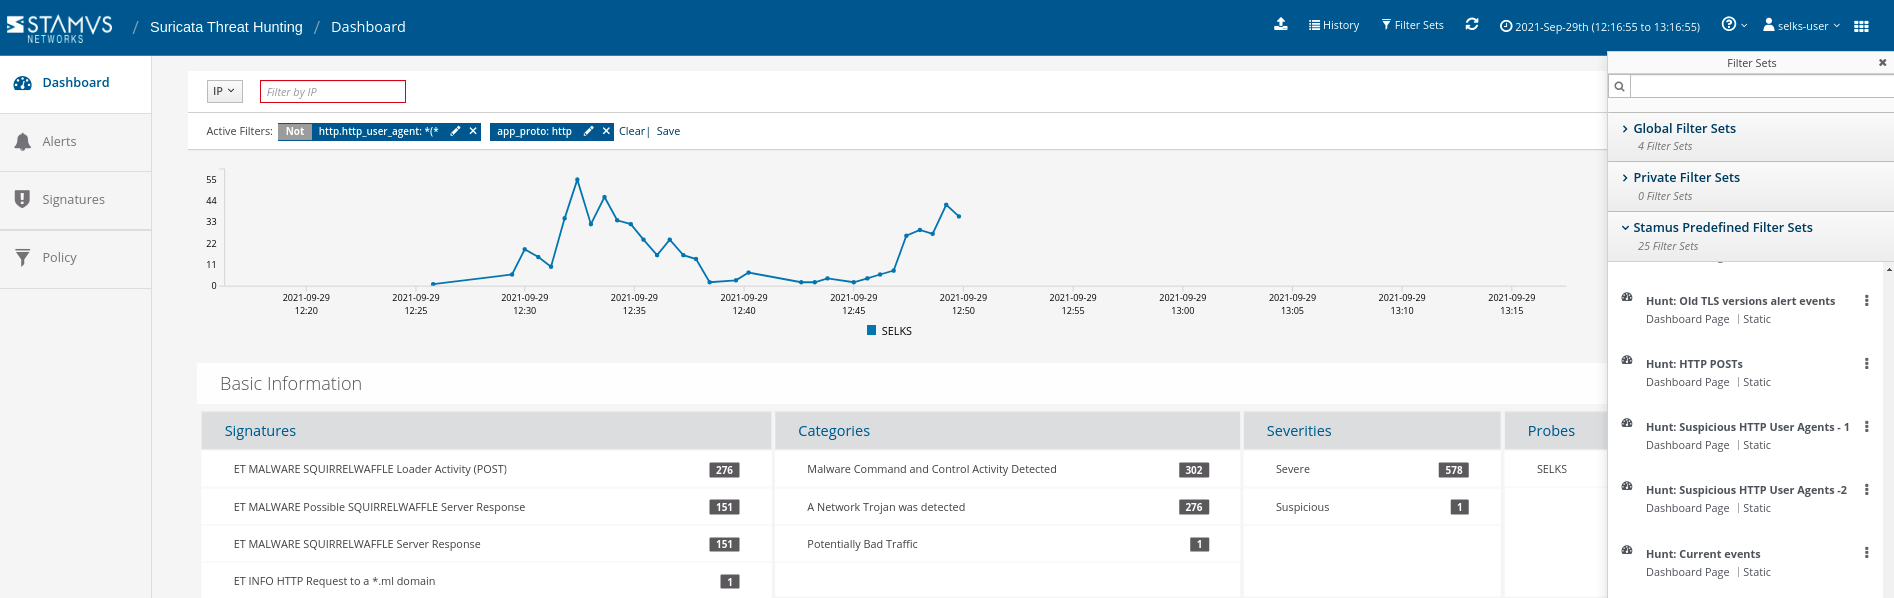
Figure 4. Creating threat hunting filters
In Figure 5 below, we show how a SELKS user might access all associated HTTP protocol data such as hostname, URL, return code and user agent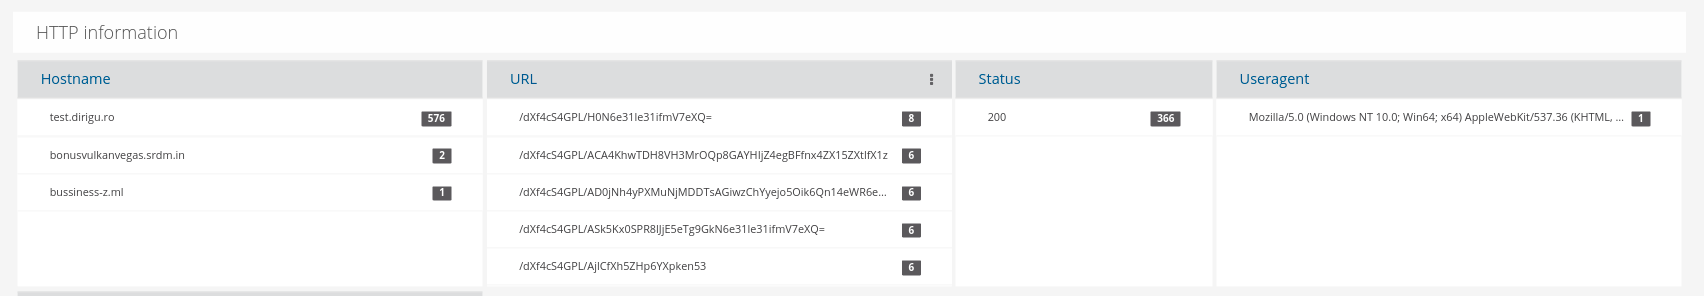
Figure 5. Associated HTTP alert metadata
Figure 6 below shows that Suricata can also give us a pretty good snapshot from the TLS protocol logs for server name indication, subjects and issuers that can serve the investigation.
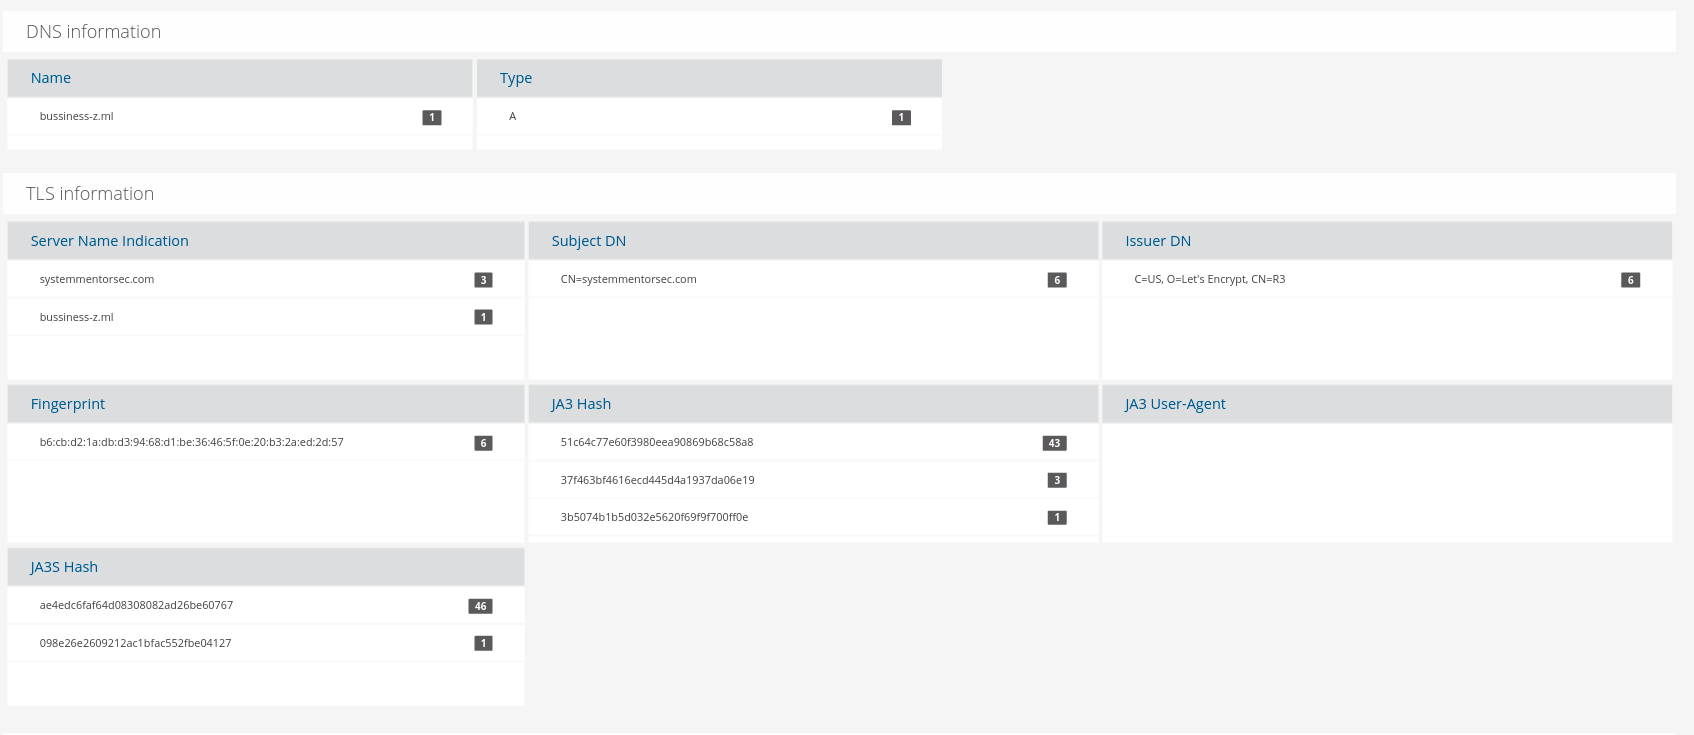
Figure 6. Associated DNS and TLS alert metadata
The Suricata Threat Hunting user interface will also display all metadata available for a given alert, in a per-category table or in native json. (Figure 7)
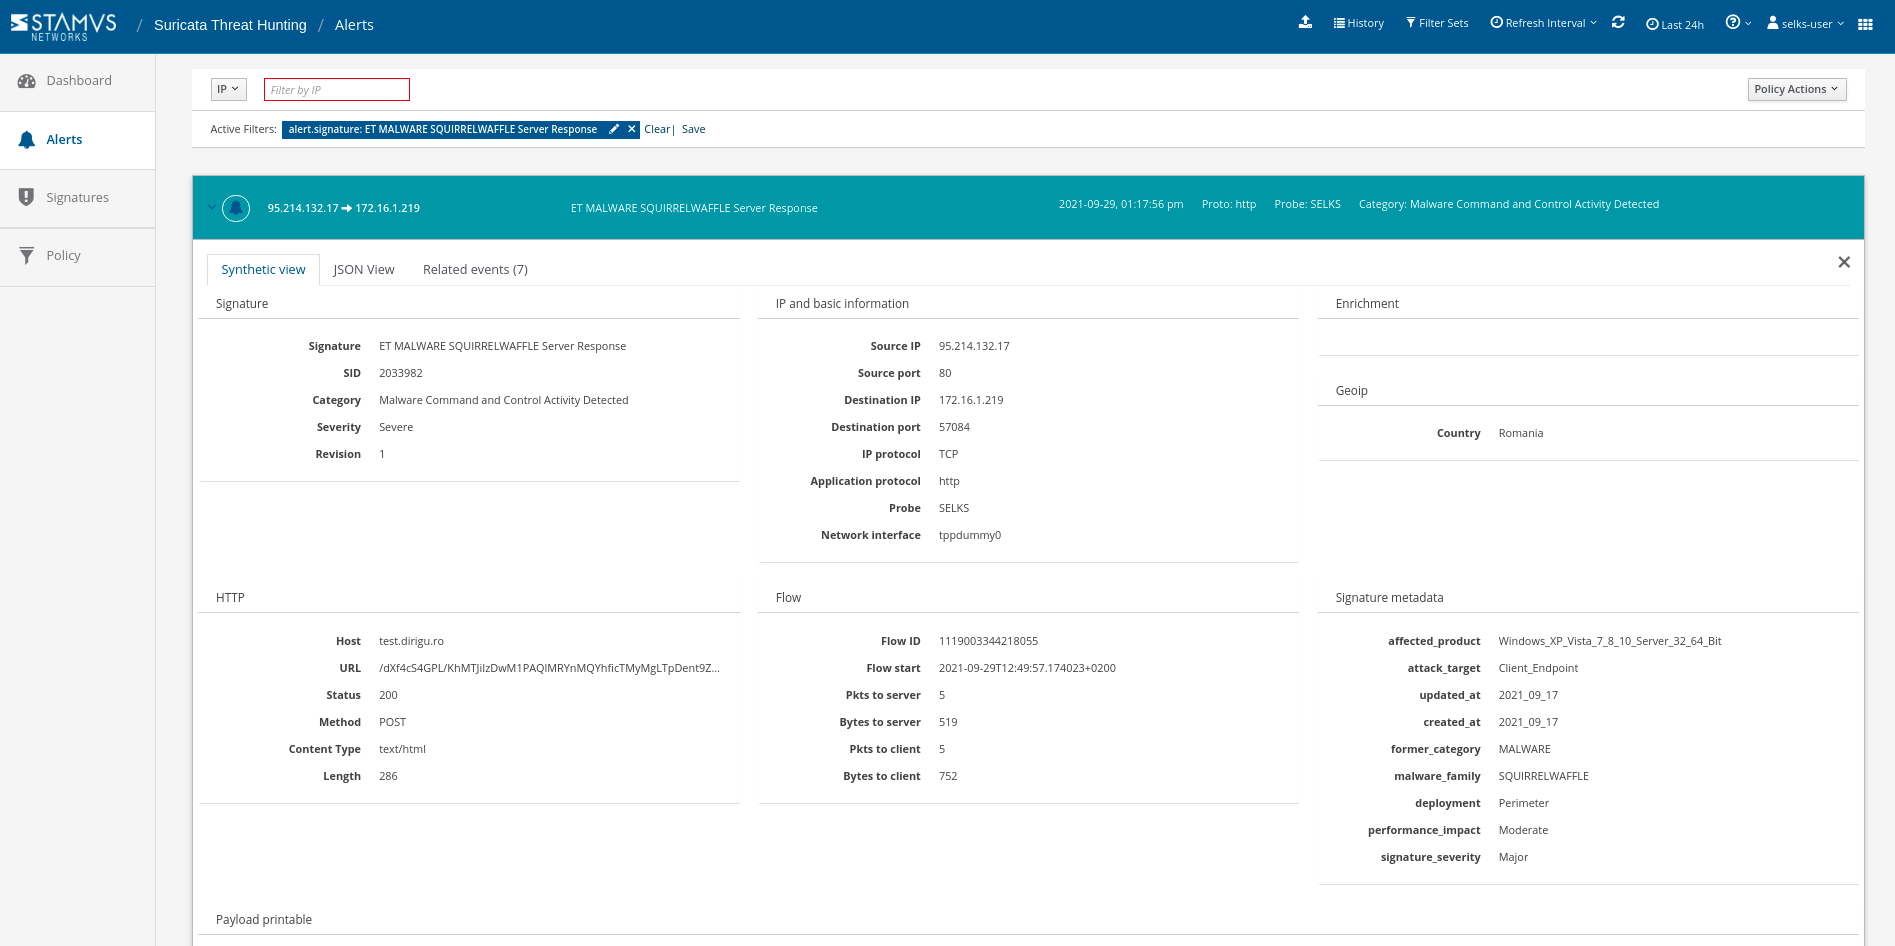
Figure 7. Complete metadata display for one alert
If there is a payload available, as part of the transaction, they will all be displayed in the alert view. (Figure 8)
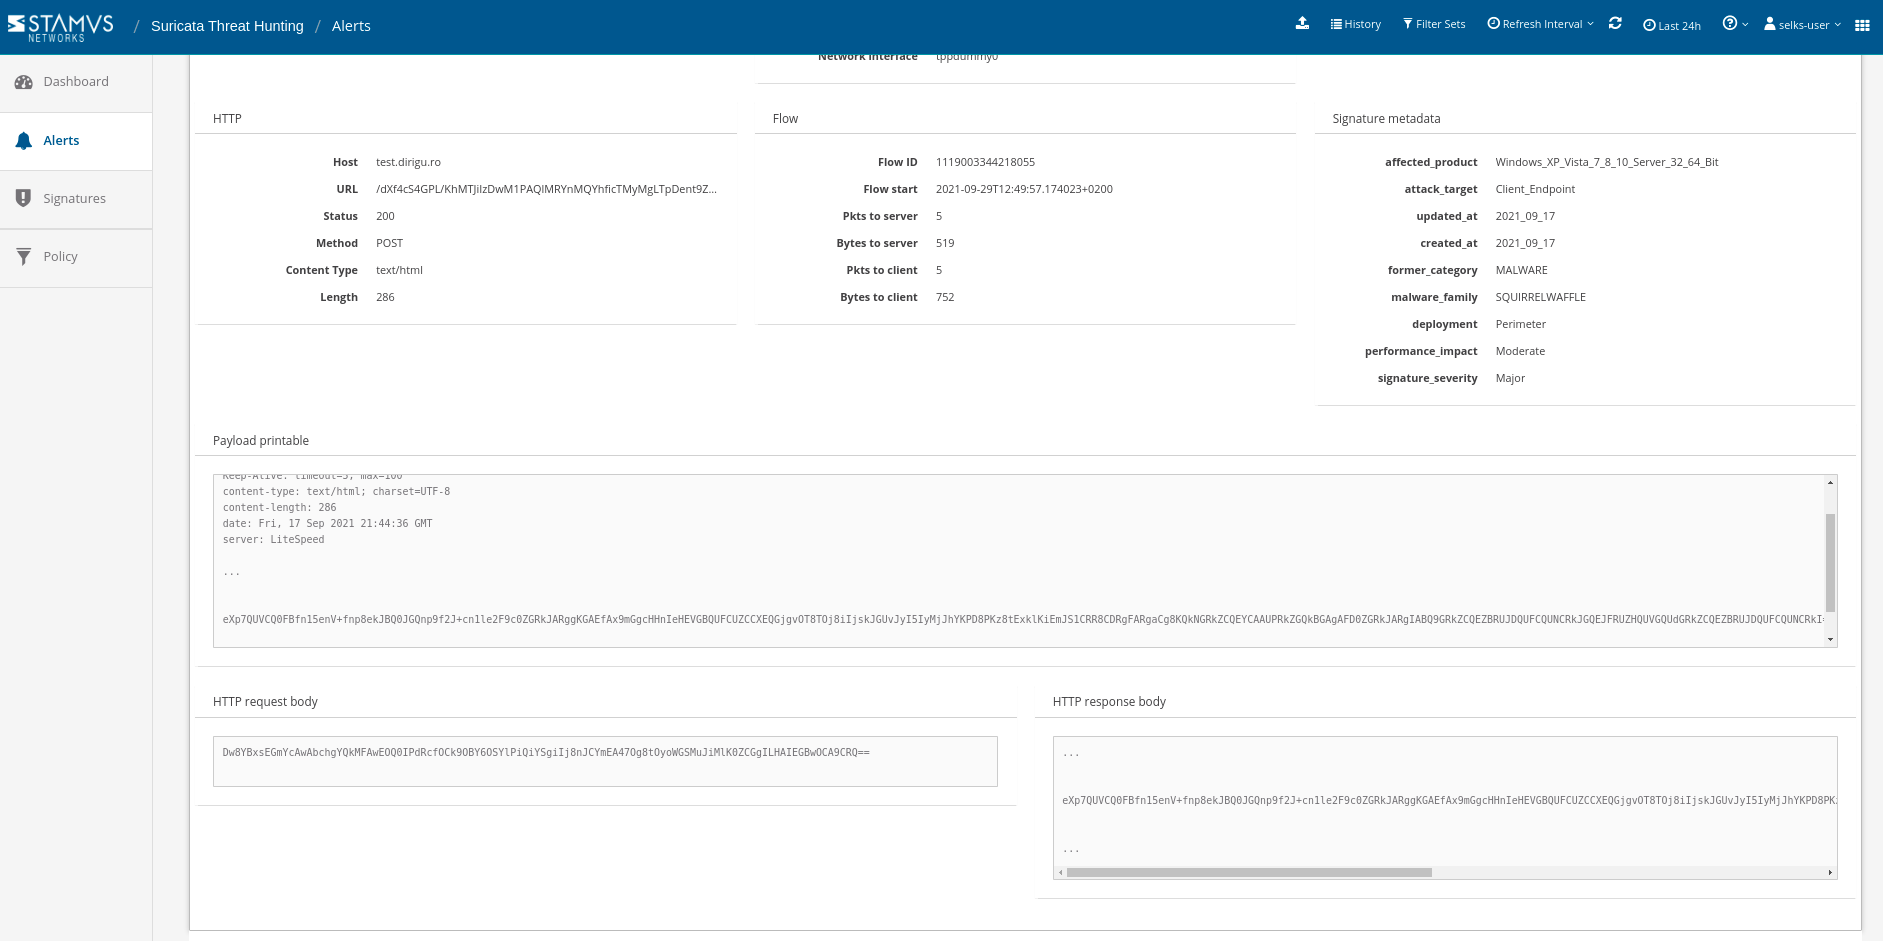
Figure 8. Associated payload alert metadata
This next series of screenshots (Figures 9-11), we can see the full network transaction logs as supporting evidence of the "alert". In this case we see related file info, HTTP transactions, flow records, and alerts to lend additional evidentiary support to the basic alert metadata:
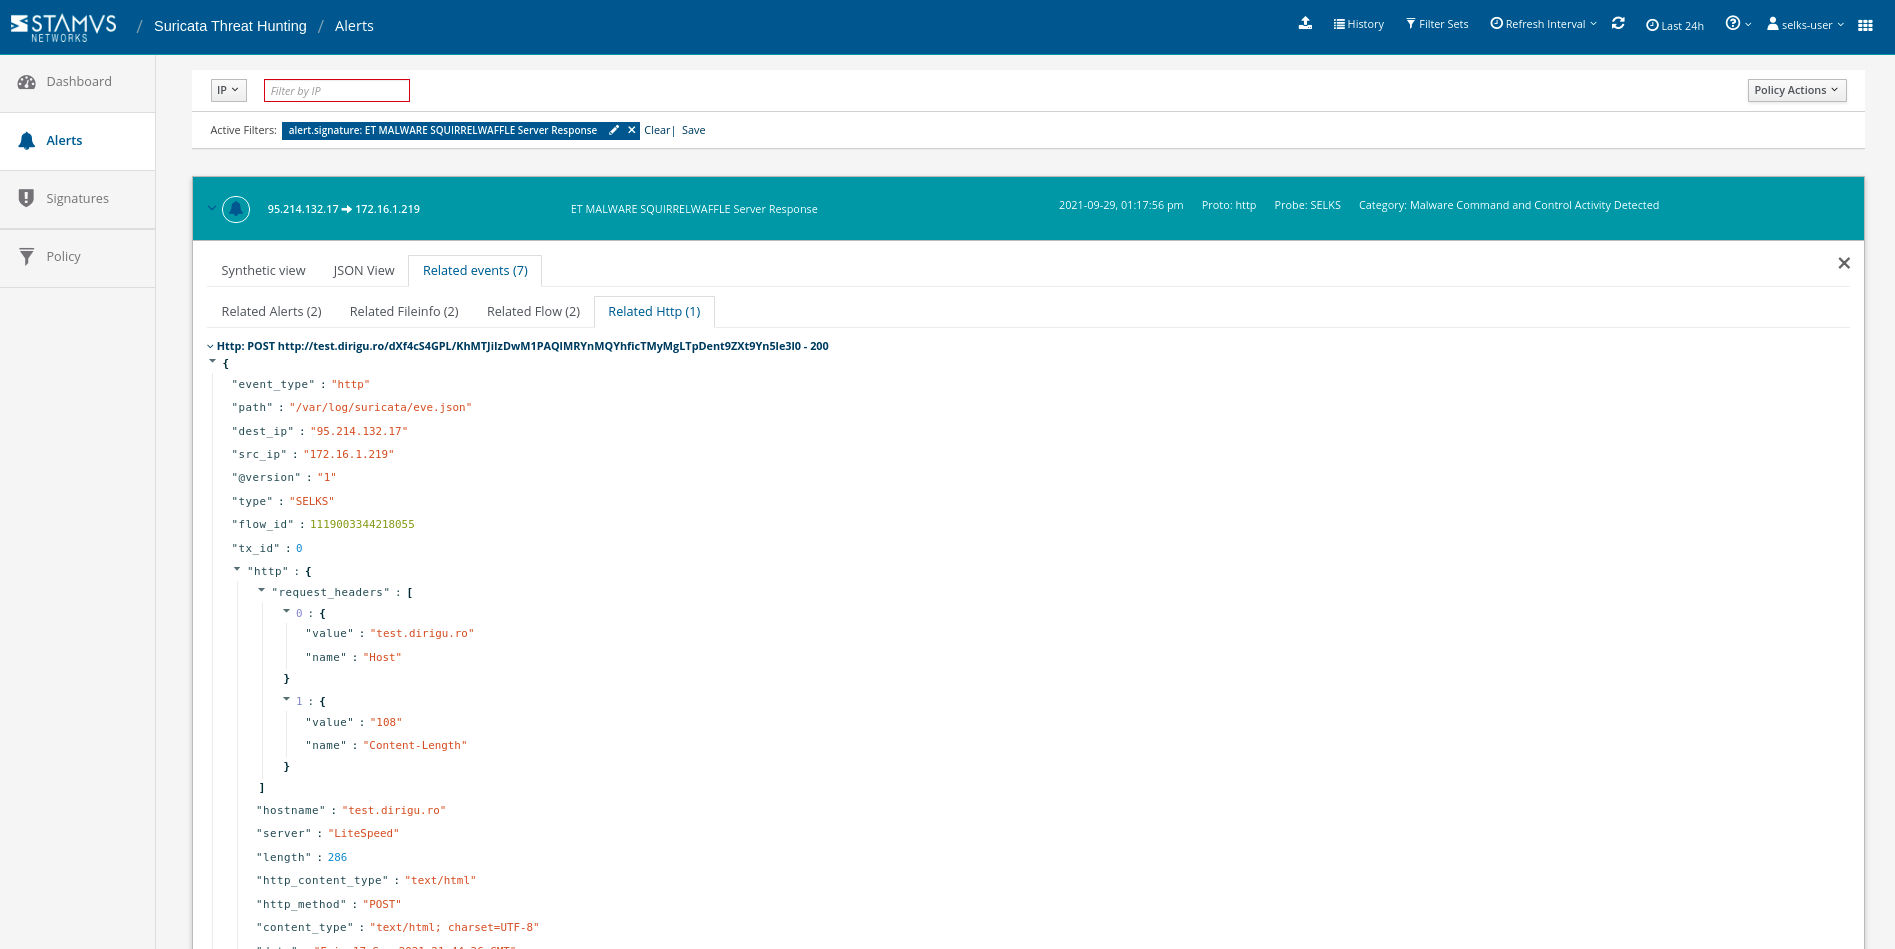
Figure 9. Associated flow records and HTTP protocol transaction logs
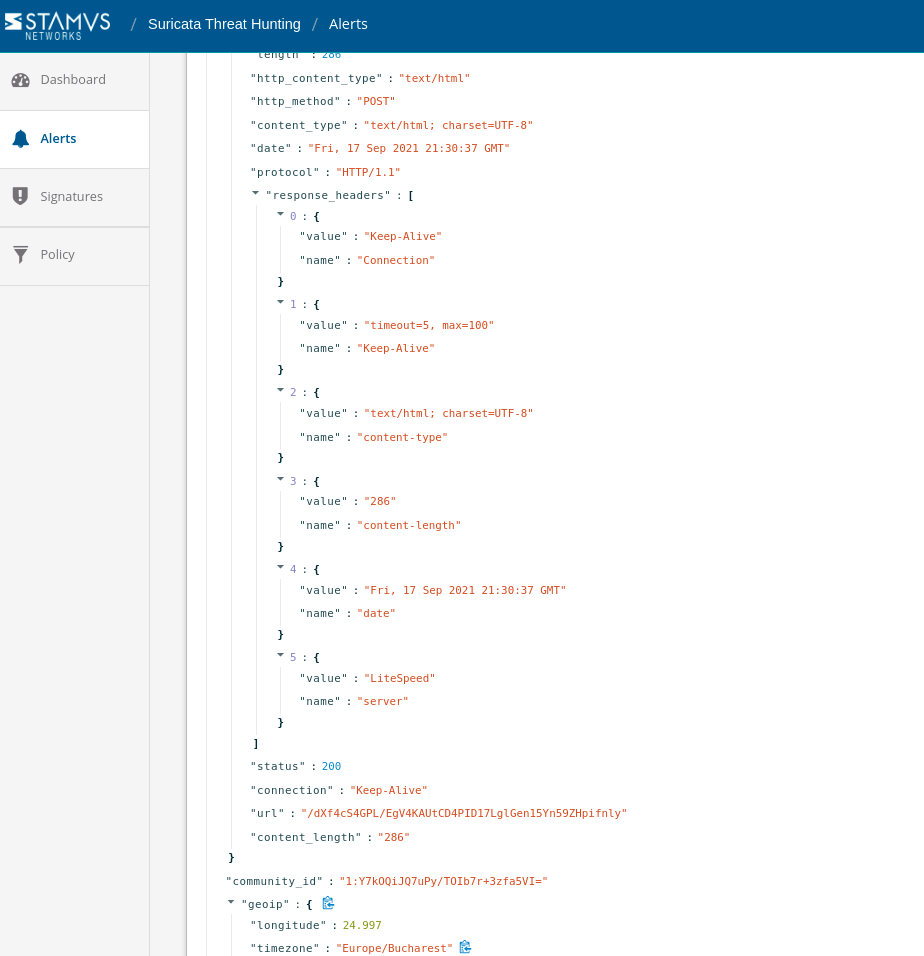
Figure 10. HTTP transaction log example (2 of 3)
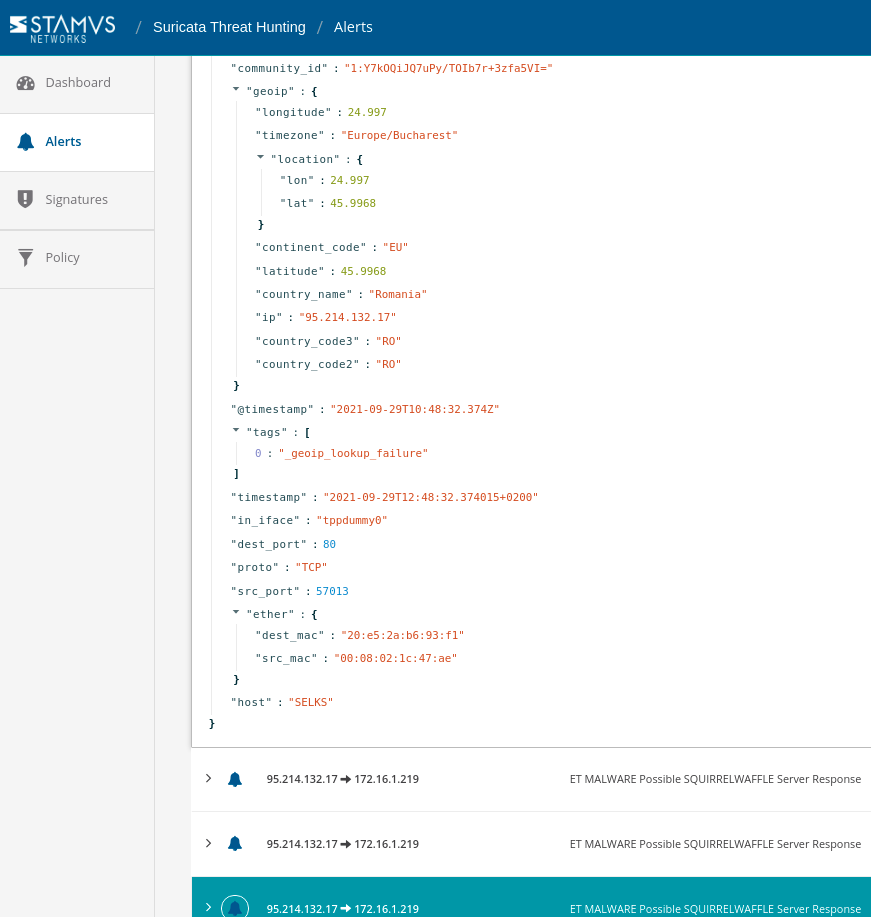
Figure 11. HTTP transaction log example (3 of 3)
Network Communication and Metadata
There are also plenty of dashboards to discover inside Kibana. In Figure 12 below, we see a Kibana dashboard displaying various DNS metadata as part of all DNS transactions, such as source, destination, dns rrname and dns.rrtype. We could see what kind of queries have been started by the host towards the dns server. Links to Evebox for flow correlation are also available. Other DNS metadata is visible in pie charts too.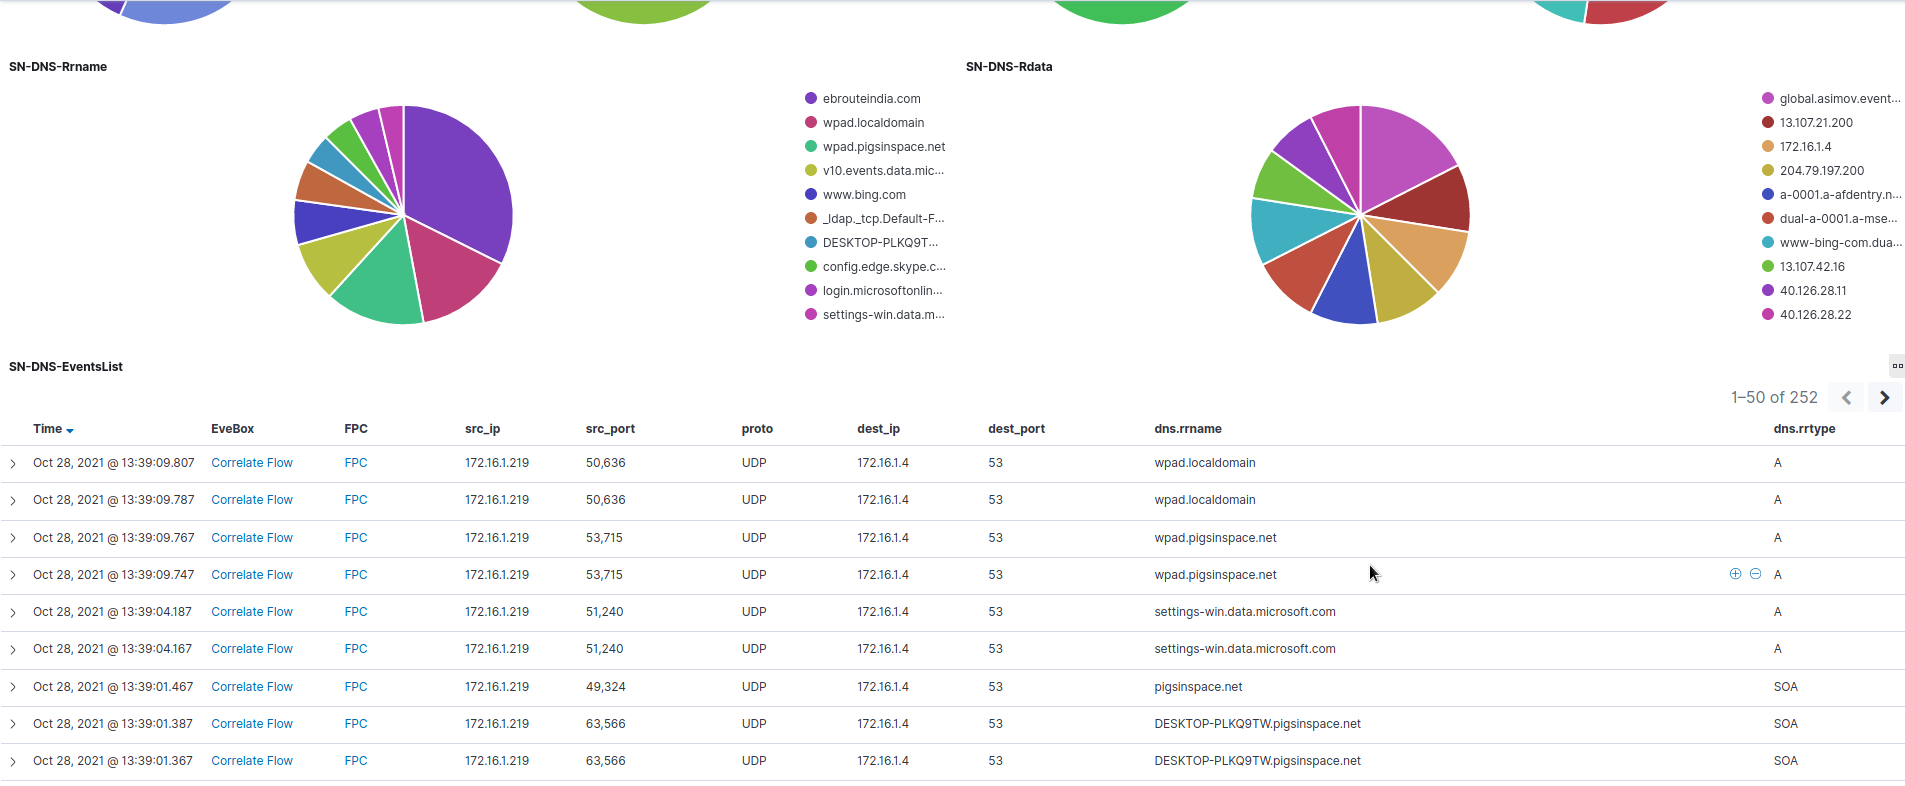
Figure 12. DNS protocol events dashboard in Kibana
Kerberos is currently the default authentication technology used by Microsoft Windows, and thus the most widely exploited authentication protocol. In Figure 13, below we show the KRB5 authentication dashboards.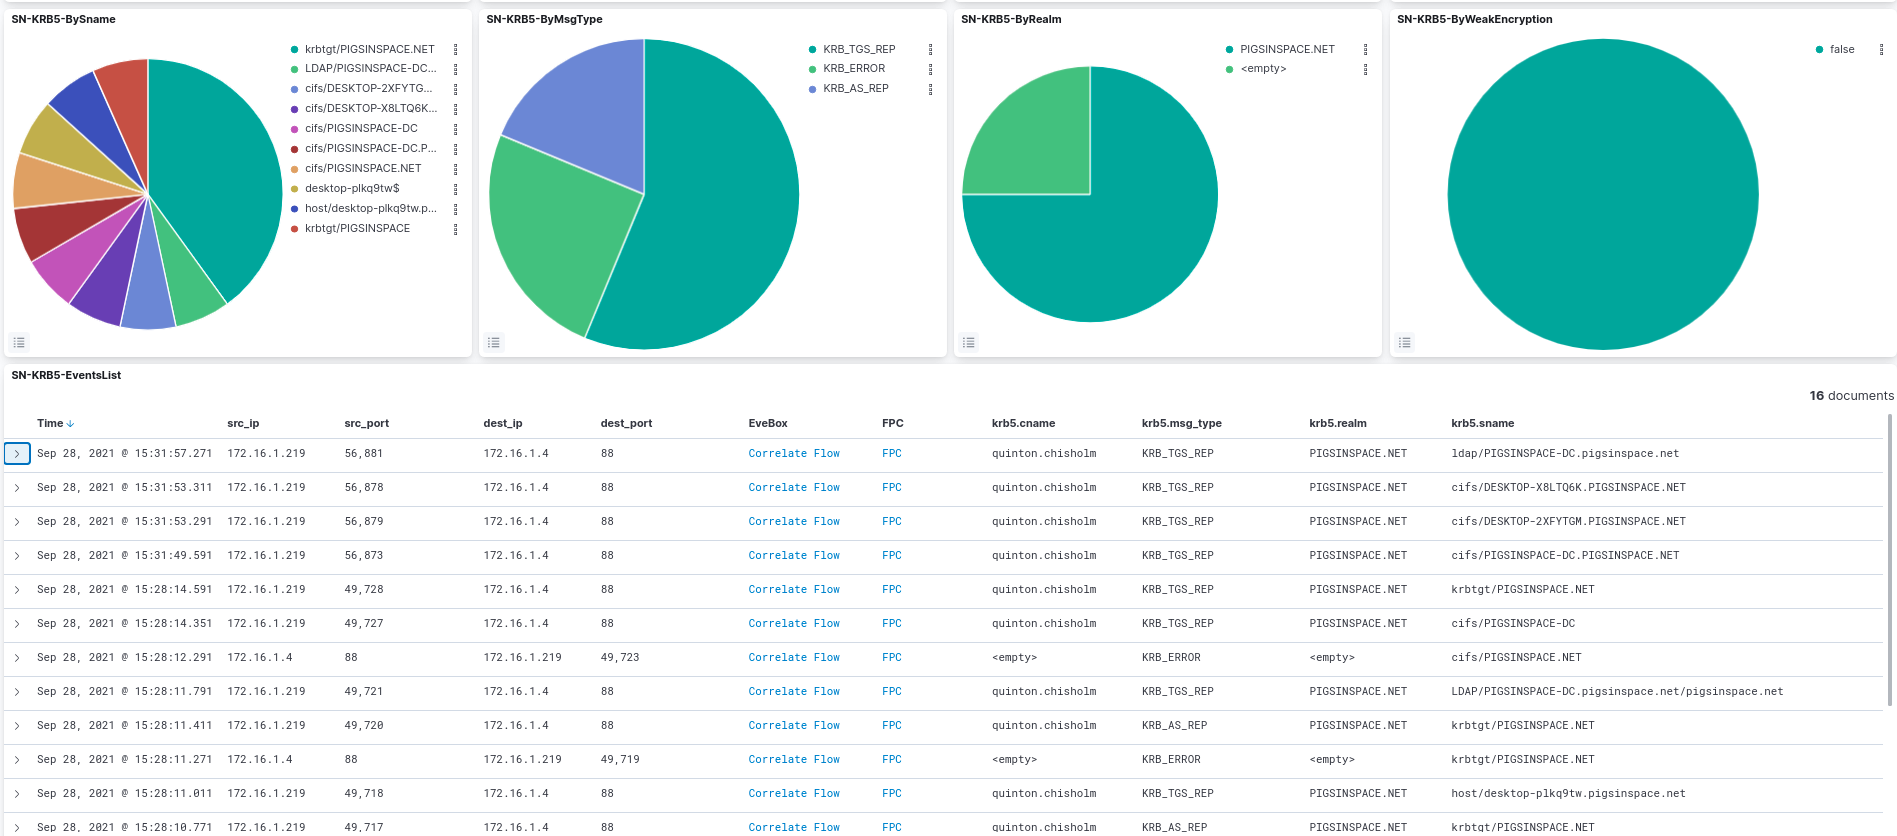
Figure 13. KRB5 authentication logs in Kibana
In Figure 14 below we show file the transaction details associated with hosts such as source, destination, application protocol, ports, filt type, file size, filename with links to the Evebox correlate flow. We can also see the top sources, destinations, and ports that initiated some kind of a file transfer.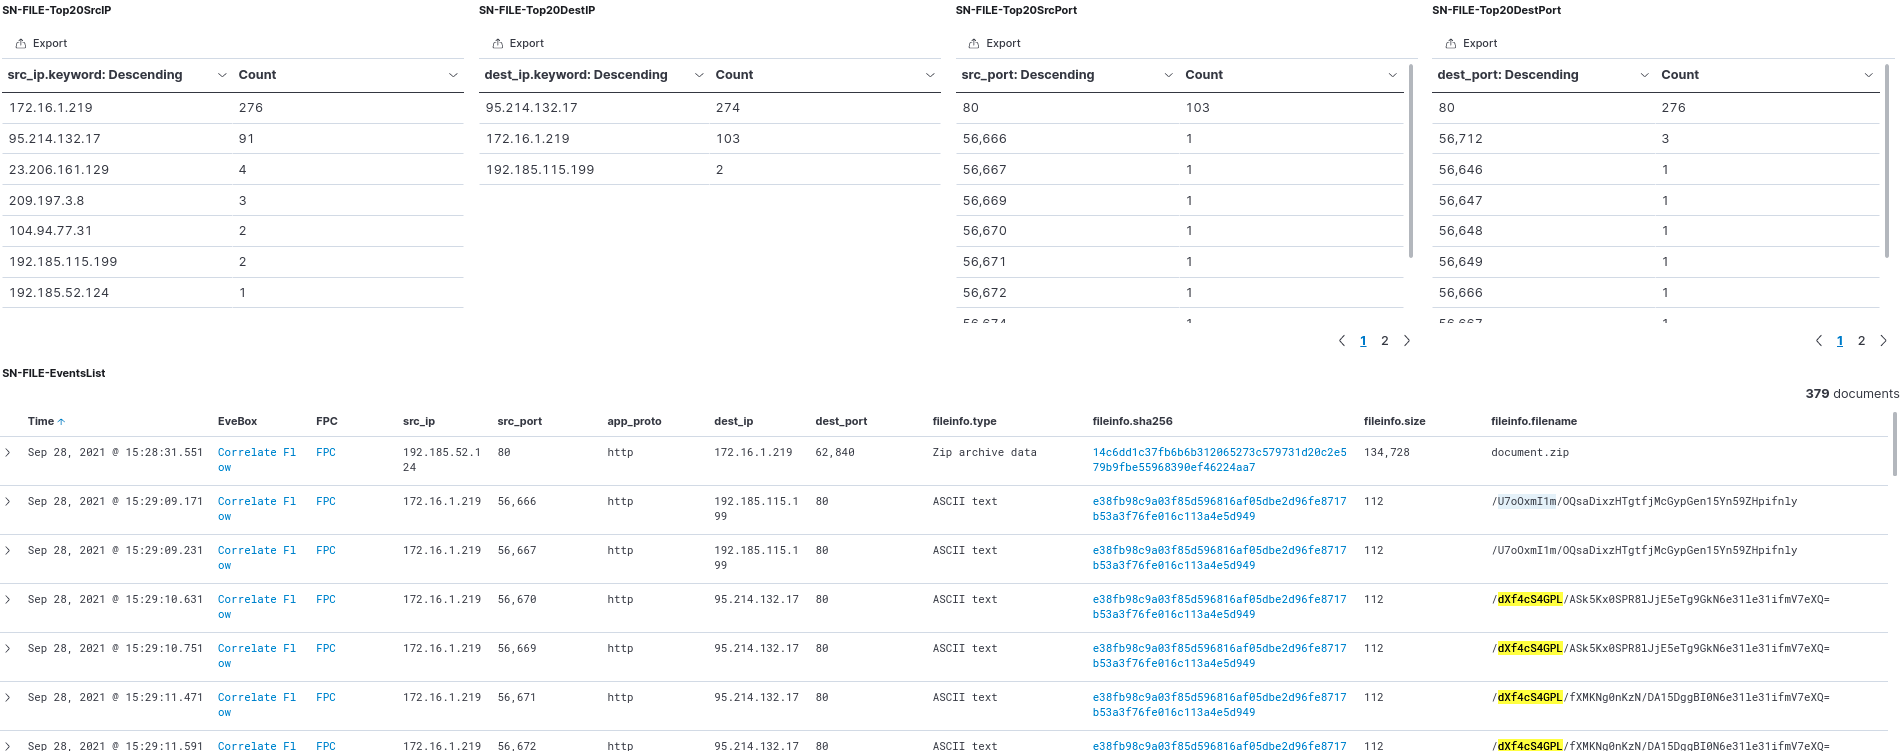
Figure 14. Detailed file transaction logs in Kibana
The HTTP dashboard shows us detailed HTTP protocol information such as an event list of last source, destination, underlying protocol, request method, hostname, returned status code, type of server, and URL. We can also correlate the whole flow with Evebox. (Figure 15)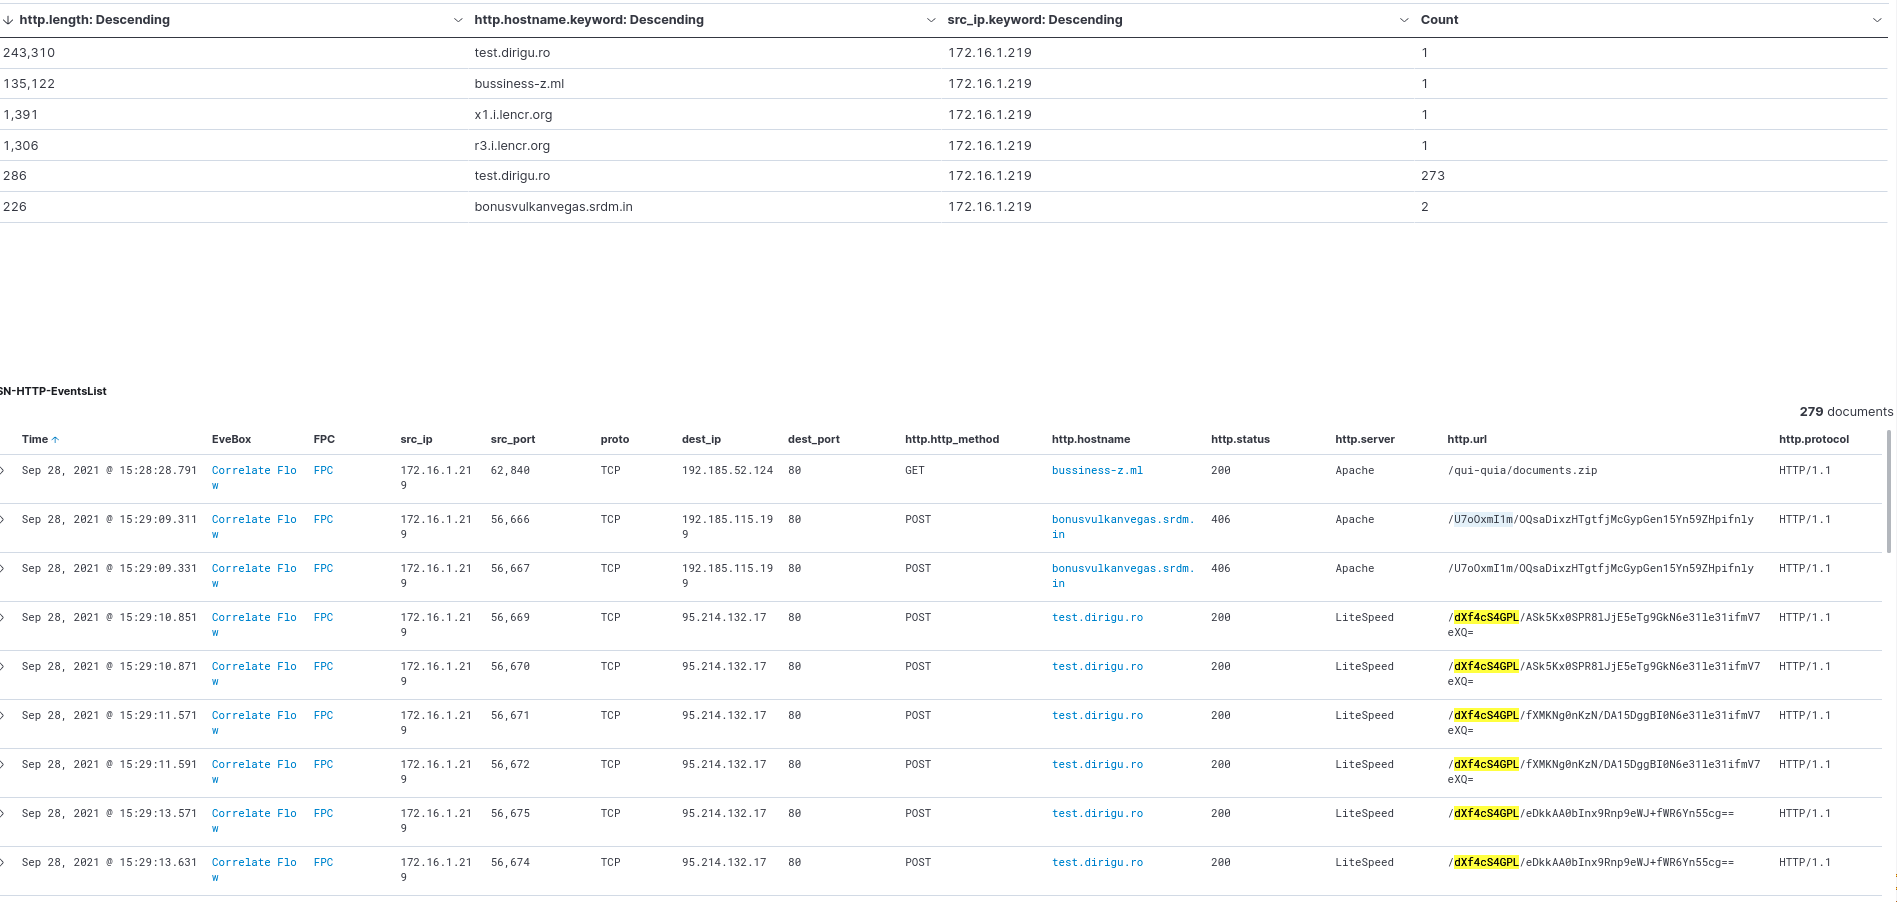
Figure 15. HTTP protocol logs in Kibana
We can use the built-in Evebox to zoom on the particular flow to get all transactions sharing the same flow_id. We can see (in Figure 16) that the flow generated by Suricata in this case is - 6 alerts, 2 http logs, 2 file transaction logs and 2 flow logs. This is a unique intelligence that helps triangulate network protocol transaction evidence to an alert.
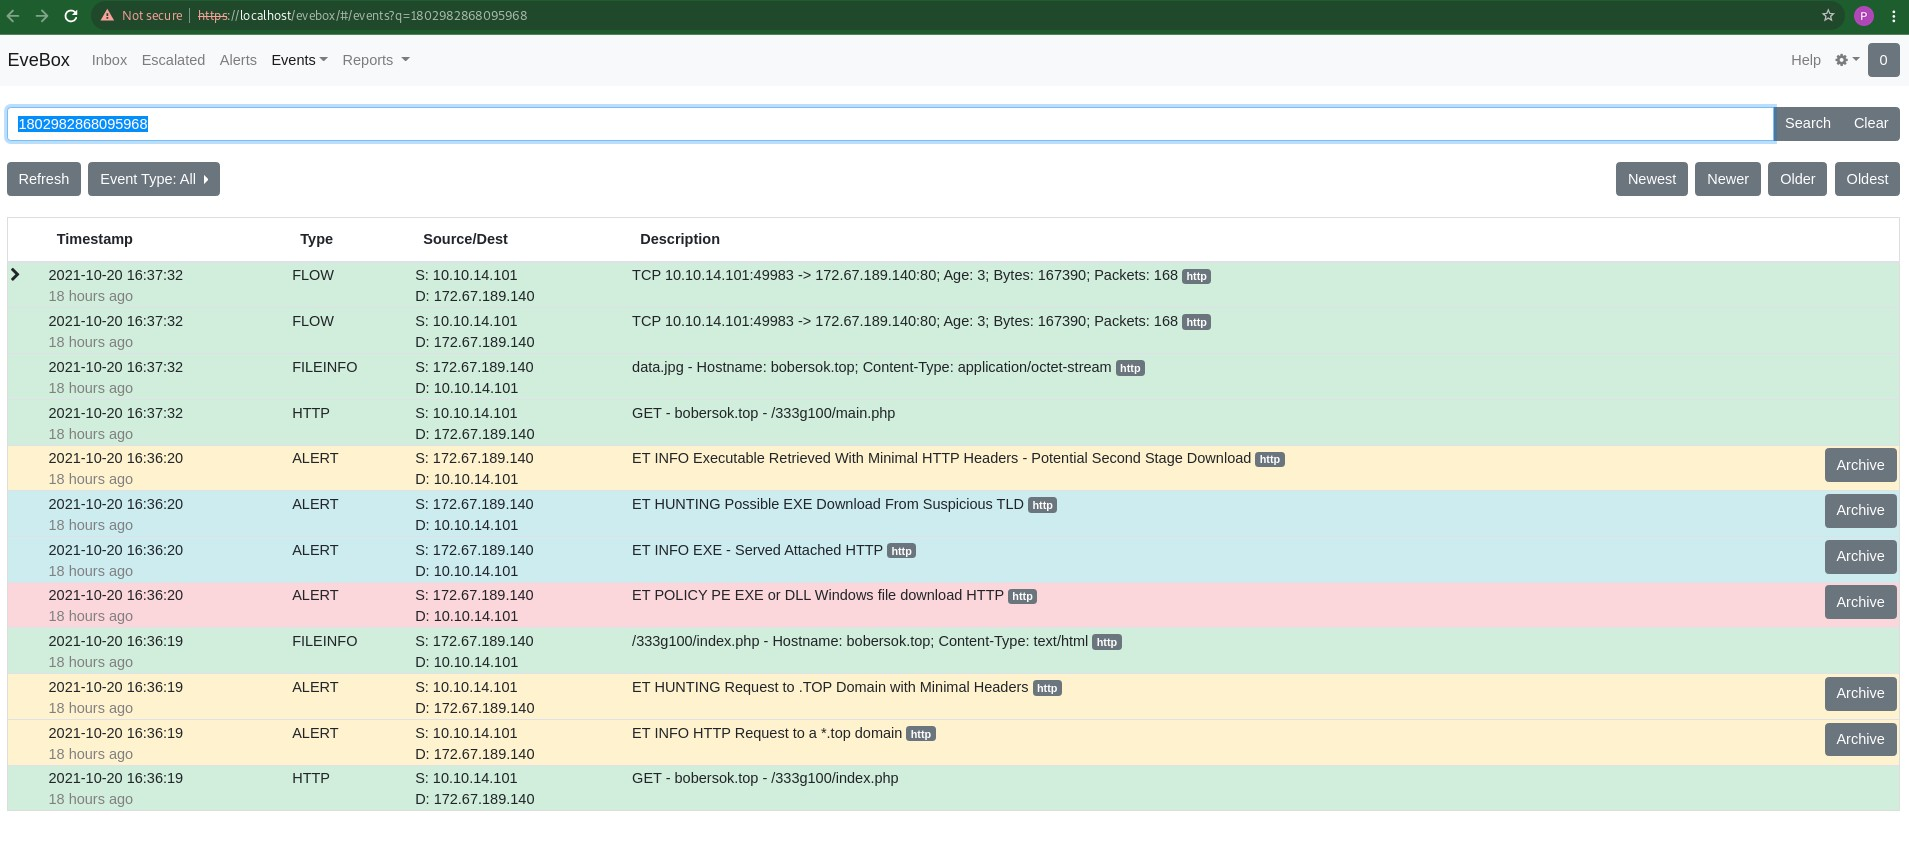
Figure 16. Evebox flow record display.
Portainer for SELKS Docker containers
Bundled in all this we can find Portainer. Portainer is a lightweight ‘universal’ management GUI that can be used to easily manage all SELKS Docker containers. To access Portainer we point our browser to http://localhost:9000 or our local IP Address. See Figures 17-19 below.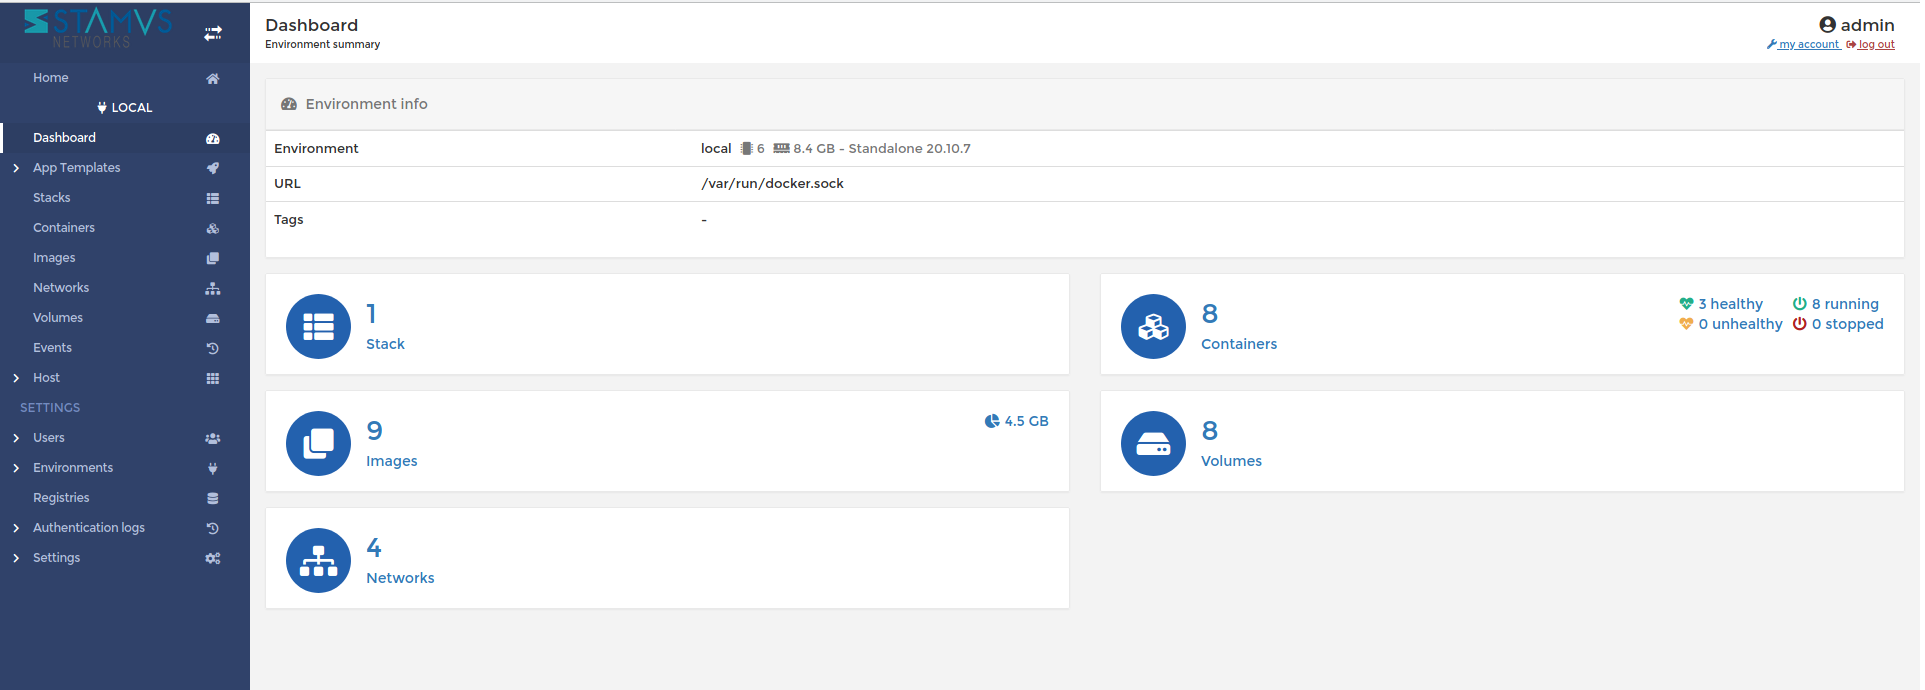
Figure 17. Portainer management UI for SELKS Docker containers (1 of 3)
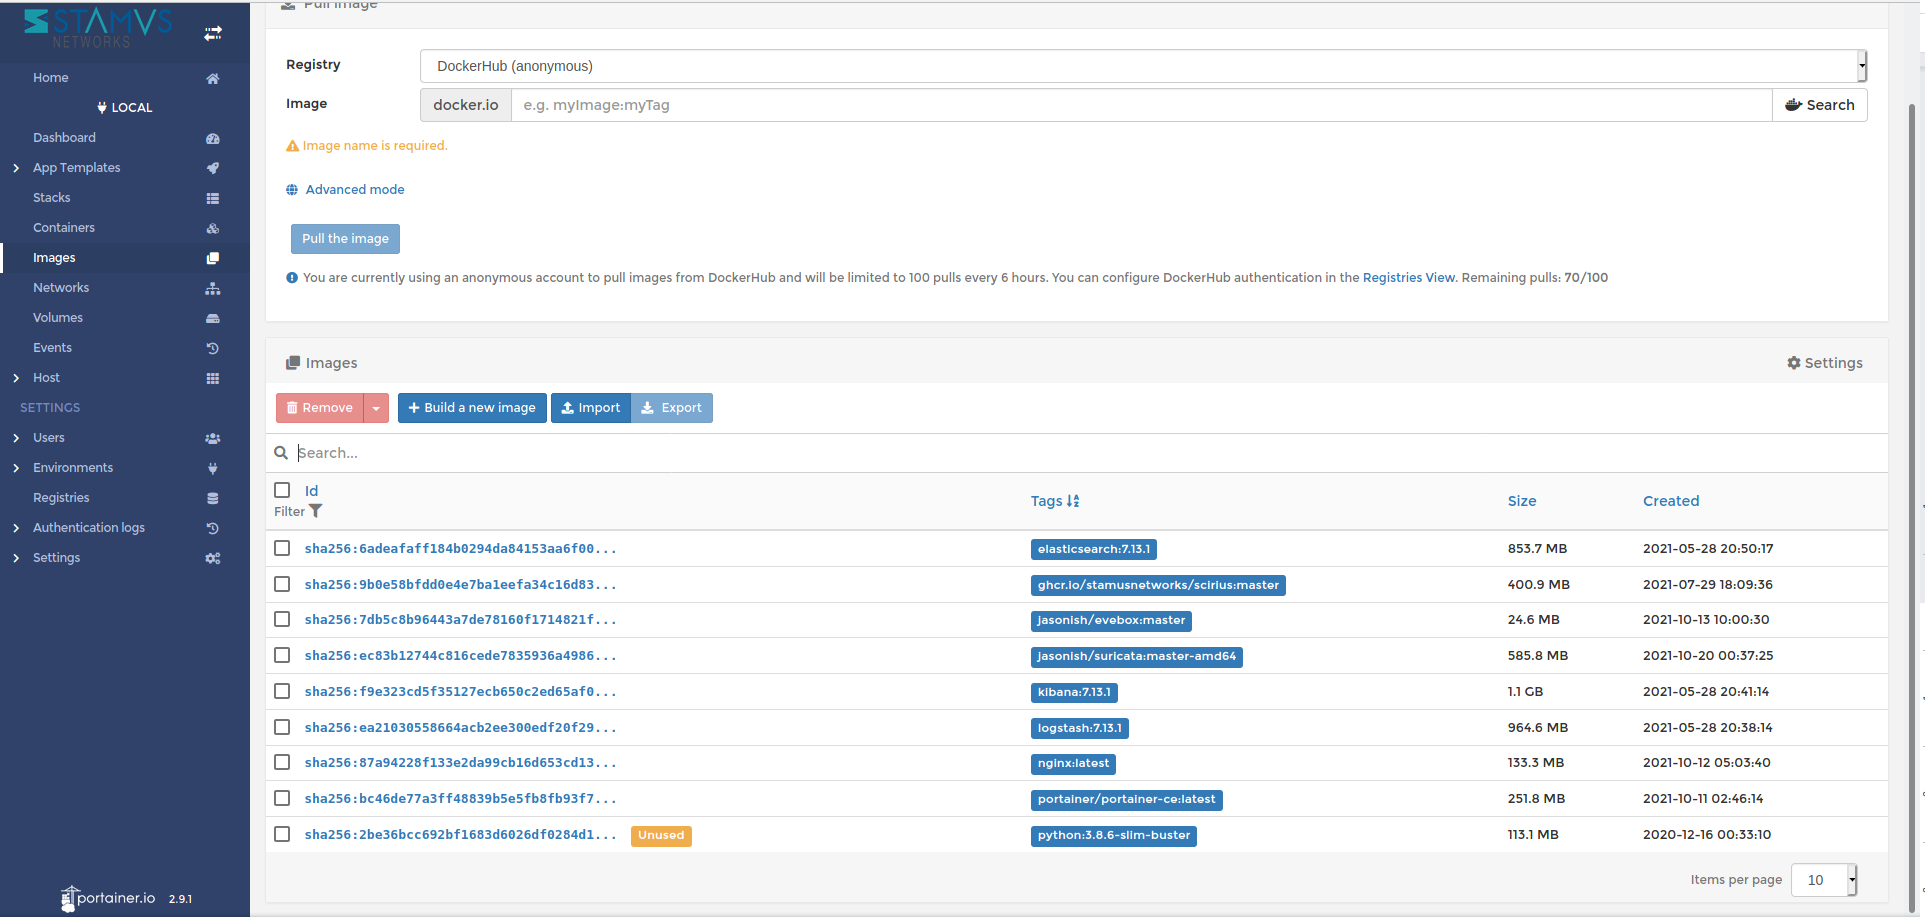
Figure 18. Portainer management UI for SELKS Docker containers (2 of 3)
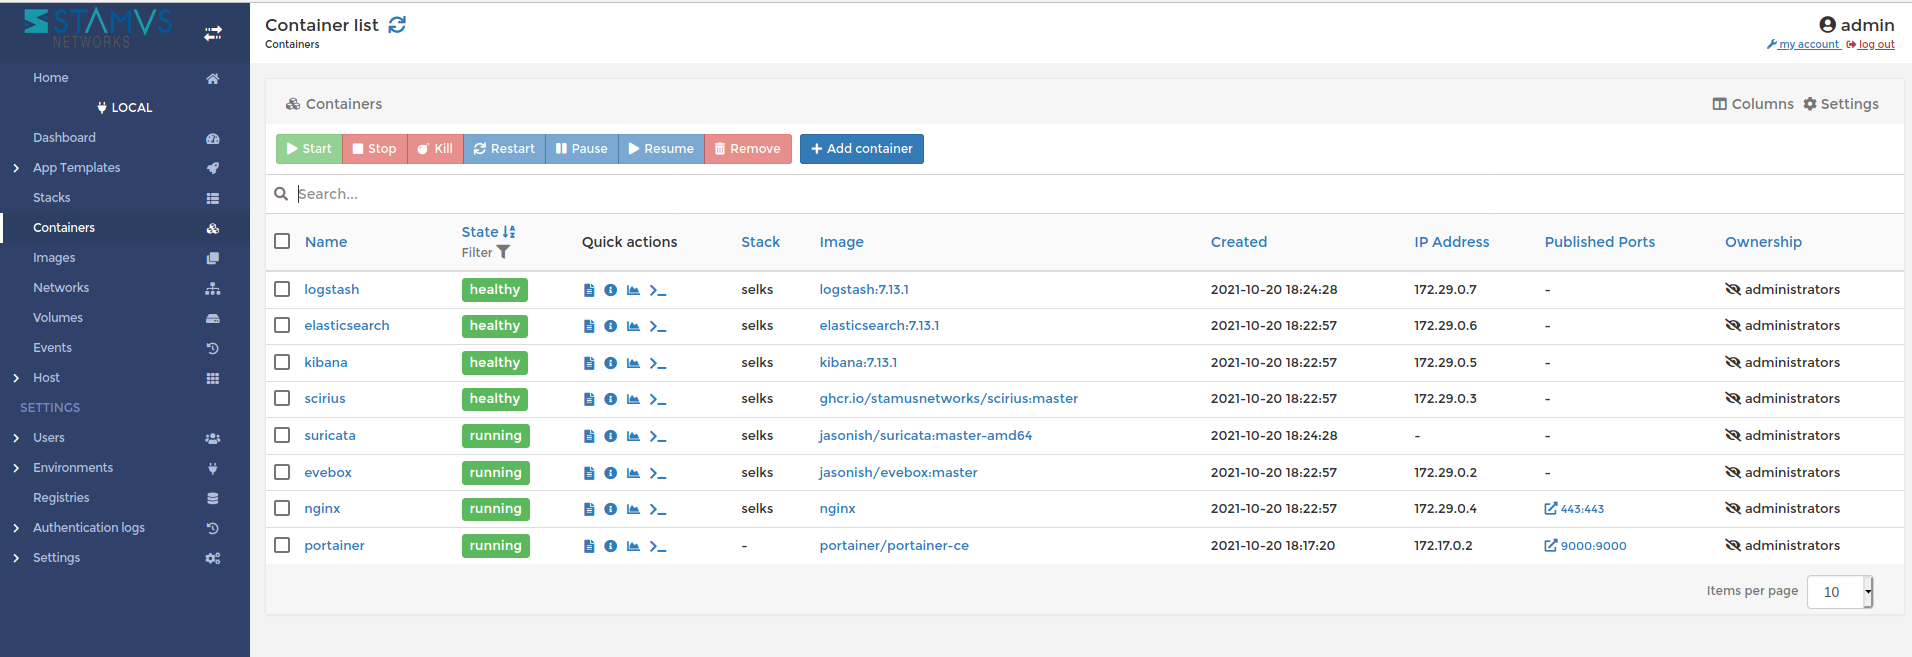
Figure 19. Portainer management UI for SELKS Docker containers (3 of 3)
Below, is an example of a one-line script that can be used to investigate any PCAP from Malware Traffic Analysis (MTA) right away:
FOLDER="/tmp/" && \
FILE="https://malware-traffic-analysis.net/2021/10/05/2021-10-05-MirrorBlast-infection-traffic.pcap.zip" && \
PCAP_FILE=$(echo "${FILE##*/}" | sed 's/.zip//g') && \
wget -O "${FOLDER}${FILE##*/}" ${FILE} && \
unzip -P infected "${FOLDER}${FILE##*/}" -d ${FOLDER} && \
sudo ip link add tppdummy0 type dummy && sudo ip link set tppdummy0 up ; sudo ifconfig tppdummy0 mtu 1572 && \
git clone https://github.com/StamusNetworks/SELKS.git && cd SELKS/docker/ && \
time ./easy-setup.sh --non-interactive -i tppdummy0 && \
time docker-compose up -d && \
sleep 120 && \
sudo tcpreplay-edit -i tppdummy0 --pps=50 --mtu-trunc "${FOLDER}${PCAP_FILE}"
Summary
SELKS allows you to quickly spot trends and anomalies within the network, as well dig into the data to discover root causes of alerts, such as malicious user agents or vulnerable ports. And with this extracted data, you can make informed decisions on how to respond to and protect your network from any harmful threats.
Hopefully, you will agree that deploying a Suricata-based IDS/IPS/NSM can be an easy job, especially with Stamus Networks and SELKS by your side.
Advanced users can also dig deeper to create their own set of rules to prevent future intrusions to your network. In addition, SELKS can be a platform for you to learn and contribute to the community.
Learn by browsing through malware analysis websites and replaying downloaded PCAP files to observe and understand how different malicious threat families behave.
Contribute by joining the SELKS community, and share your issues or help others resolve theirs. Do you have a great idea for making SELKS even better ? Great. Submit a feature request or code it yourself, and make a pull request towards the SELKS github public repository.
Connect with the SELKS Community
Join the conversations around SELKS and learn from your peers through the available online channels:
Wiki: https://github.com/StamusNetworks/SELKS/wiki
GitHub: https://github.com/StamusNetworks/SELKS
Google groups: https://groups.google.com/g/selks/
And coming soon, we’ll be adding a Discord server dedicated to the SELKS and Suricata user community.
Commercial Alternatives to SELKS and Suricata
Finally, if you tried SELKS but you realize you need more to meet the needs of your enterprise, I encourage you to check out the enterprise solution from Stamus Networks - Stamus Network Detection and Response (Stamus NDR) along with the turnkey Stamus Network Appliances.
To learn more about the differences between SELKS and Stamus NDR, you can download the white paper entitled “Understanding SELKS and Stamus Commercial Platforms''. You may download it here: https://www.stamus-networks.com/en-us/landing/understanding-selks-and-stamus-ndr
To connect with the SELKS community, join the SELKS Discord Server.