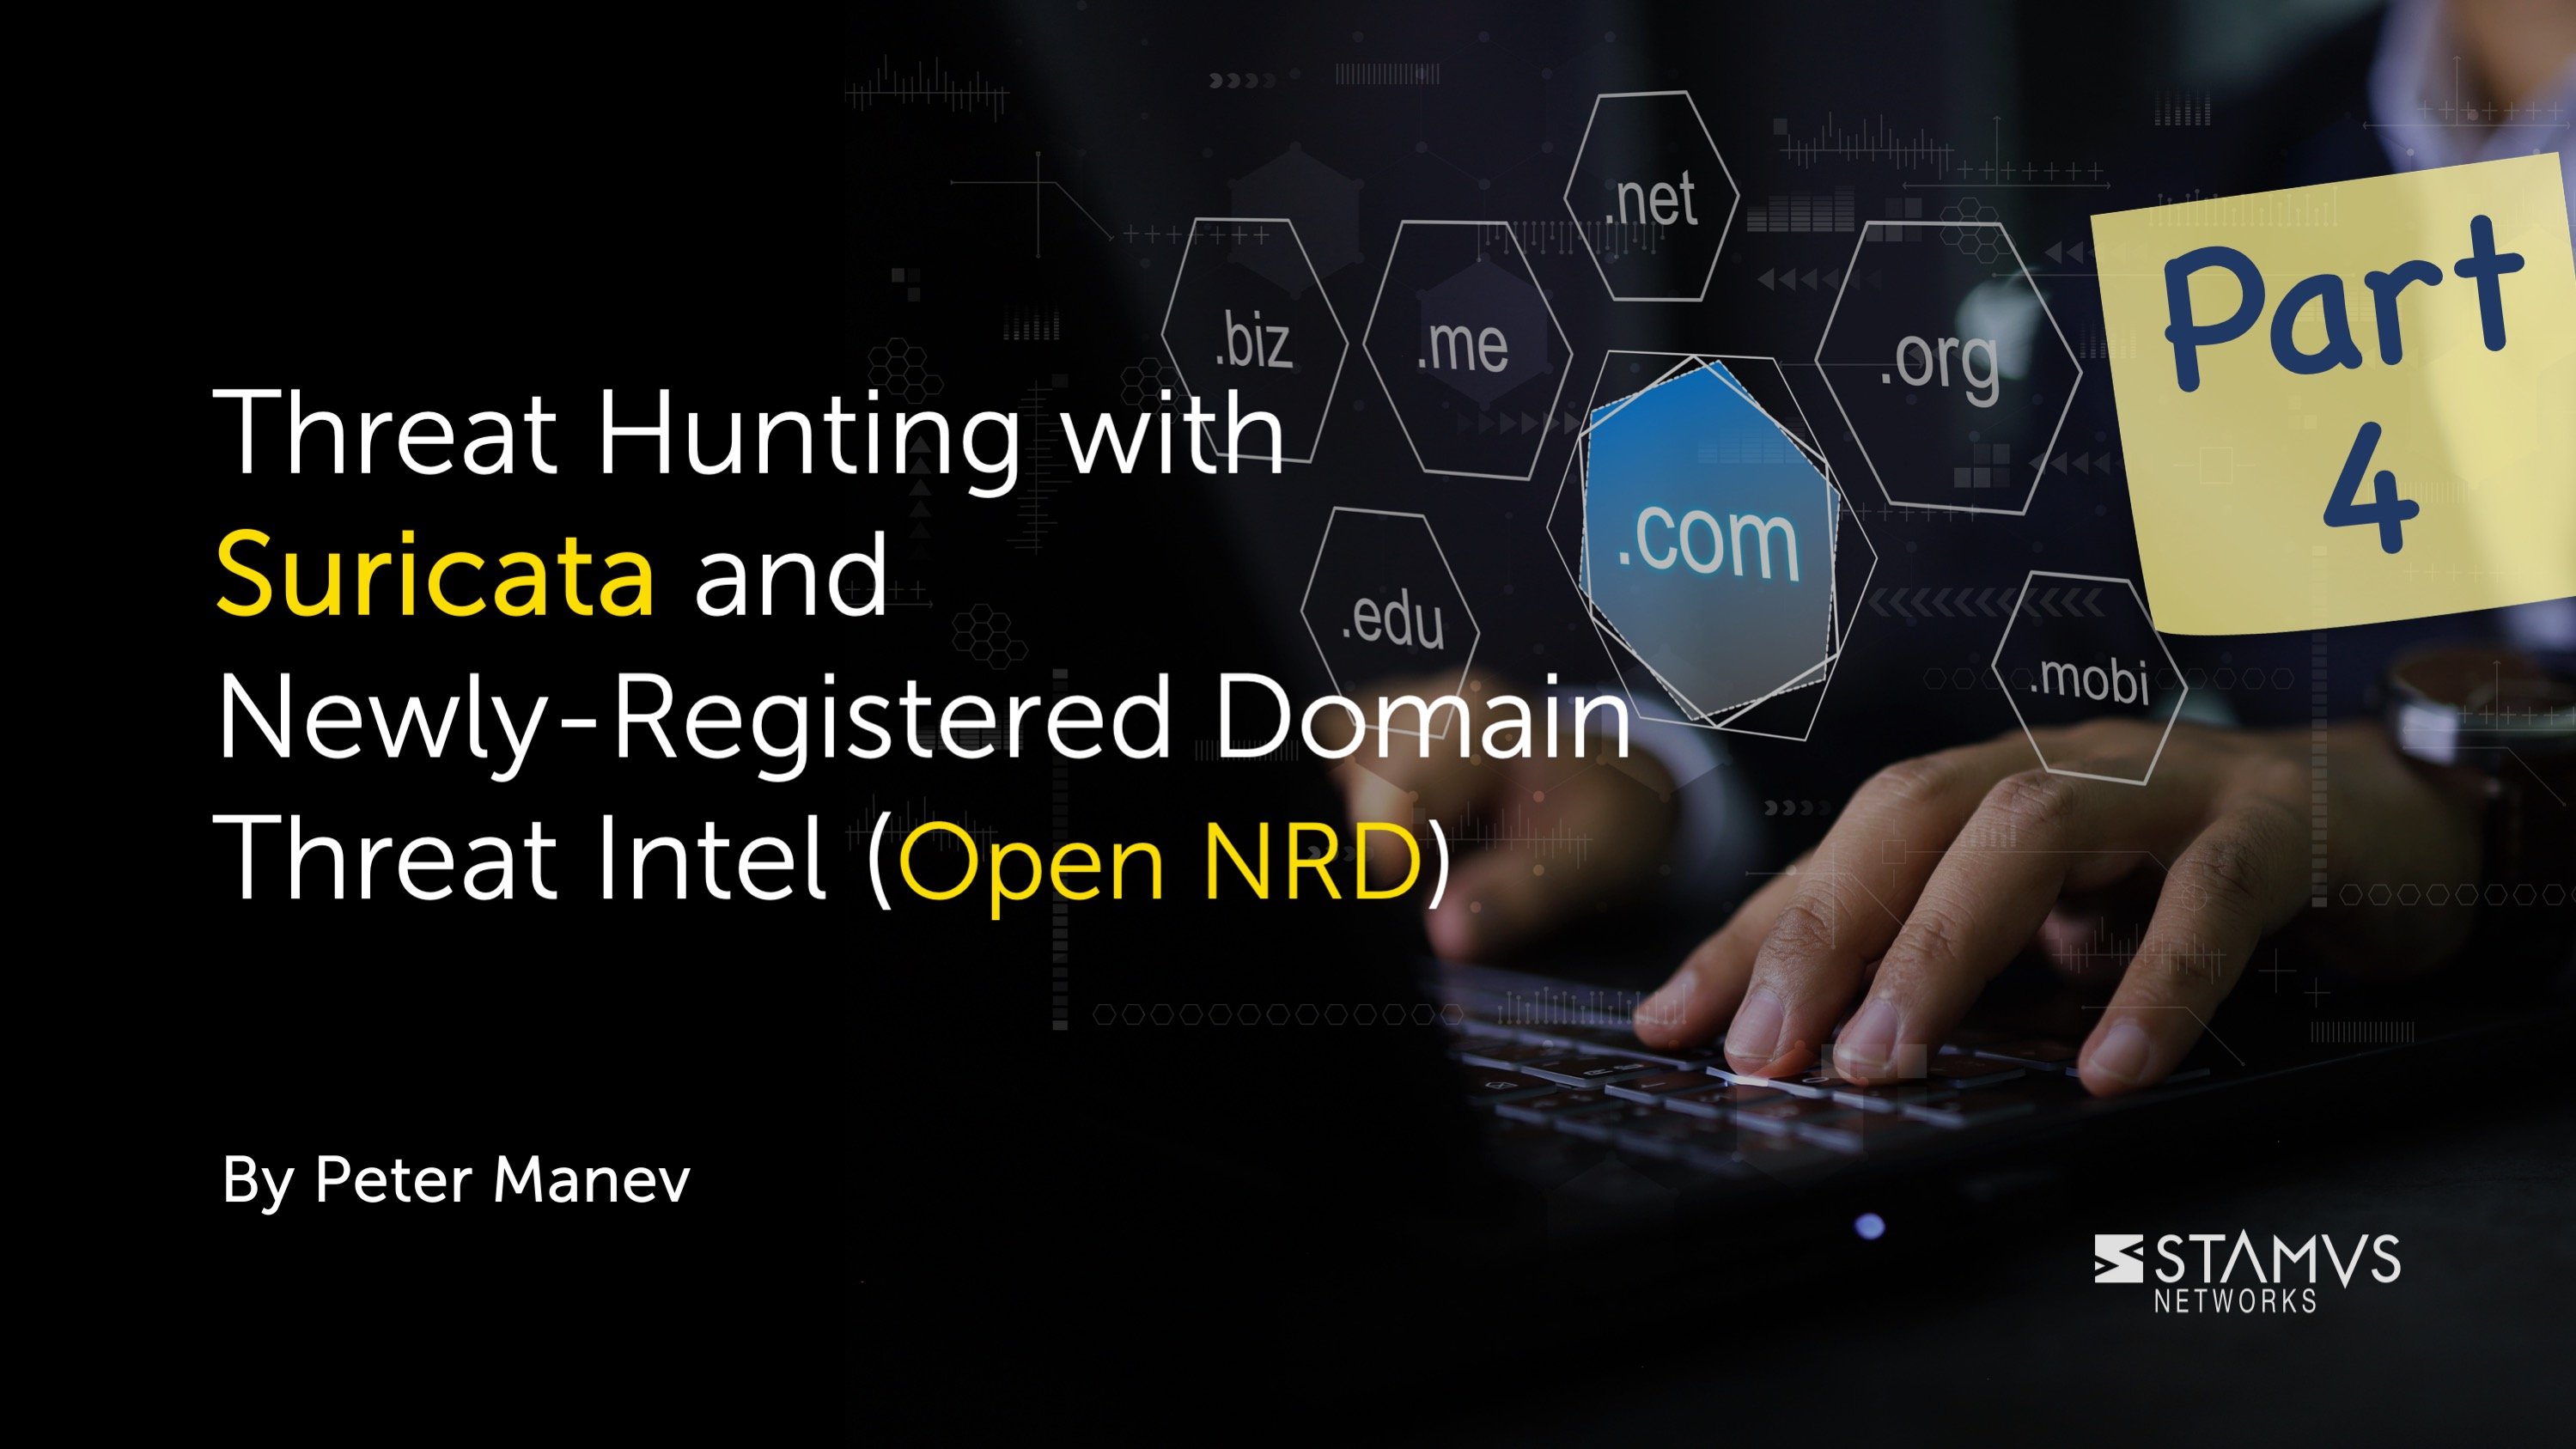
This is a follow-up to our third blog on hunting using the publicly available Newly Registered Domains (NRD) threat intel lists. In this blog, we will explore a hands-on example of infection traffic and review one of three possible detection and investigation techniques that can unearth malicious behavior.
It is important to note that NRDs are not necessarily bad by default, and an NRD alone is not enough of an IoC/match to determine whether or not it is malicious. We need to combine context with the detection itself to make that determination. But what information can help us come to our conclusion? This blog post should help give you a baseline of what to look for.
This blog post is one of five blogs introducing Open NRD and sharing various ways it can be used with Suricata for threat hunting and investigation. To review the other blog posts in the series, click on one of the following links:
- Introducing Open NRD: Newly Registered Domain Threat Intel Feeds for Suricata
- Threat Hunting with Suricata and Newly-Registered Domain Threat Intel (Open NRD) Part 1
- Threat Hunting with Suricata and Newly-Registered Domain Threat Intel (Open NRD) Part 2
- Threat Hunting with Suricata and Newly-Registered Domain Threat Intel (Open NRD) Part 3
What tools are needed?
Before beginning, there are some tools you need to ensure you can follow along:
- OpenNRD threat intel feeds - free subscription for any Suricata user
- Suricata - the article assumes Suricata 6.0.14+ or 7.0.0+ installed (with the Open NRD feeds)
- DarkGate malware infection trace PCAP - thanks to Malware traffic analysis - https://www.malware-traffic-analysis.net/2023/10/12/index.html
Before we look into the actual hunting example, we must understand three major Suricata hunting concepts. They are as follows:
- 1. The wealth of data generated by Suricata (especially beyond alerts)
- 2. How correlation is performed with Flow ID
- 3. How flow labeling with Flowbits can impact context
Suricata-generated data - more than just alerts
One of the many powerful features of Suricata is that it can create protocol and transaction logs even in the absence of alerts. These logs include flow records, anomalies, alerts, protocol transactions, and file transaction logs, plus file extraction and packet capture (PCAP).

Here is a full list and details of what those logs and transactions look like.
You also might be interested in the many new things available in the recently released Suricata 7.
Suricata data correlation with Flow ID
Suricata produces all relevant network security monitoring logs: protocol, flow, file transaction, and anomaly logs, including the ones related to an alert - but also independent of alerts. In the regular JSON logs that Suricata generates (eve.json), you will find something called “flow_id” that correlates the network protocol data and evidence that Suricata has logged - to an alert event and that alert’s metadata.
The ability to correlate any existing evidence/logs to an alert (“flow_id”) was introduced in 2014 by Suricata lead developer, Victor Julien
https://github.com/OISF/suricata/commit/f1185d051c210ca0daacdddbe865a51af24f4ea3
Flow labeling with Flowbits can provide context
Suricata can match or highlight on specific simple events, occurrences, anomalies, patterns, or IoCs and also much more complex detection logic either via signature or a lua script – in flows/sessions or cross flows/sessions.
Regardless of what type of match is used we can insert a piece of metadata in all protocol transactions generated by Suricata. This way, multiple different labeling of varying flows can occur that can later be used for detection logic SIEM/DB queries, alerting, and/or automation.
In other words, by using NRD matching all the Suricata protocol records to and from NRD communication that are found in either DNS Query (“event_type”:”dns”), HTTP Hostname (“event_type”:”http”), and TLS SNI (“event_type”:”tls”) will have the flowbit/marker piece of metadata inserted in them as well as any and all corresponding “event_type”:”fileinfo”, “event_type”:”flow”, “event_type”:”anomaly” event logs from those sessions/flows.
Here is an example of a flow in Suricata JSON output:

The above picture has a flow or protocol record labeled (with “stamus.nrd.entropy”) as a Newly Registered Domain communication with high entropy from Stamus’s NRD daily updated lists.
There could even be multiple matches and labeling:
…
{
"flowbits": [
"FBMproto_0",
"stamus.nrd",
"ET.http.binary"
]
}
….
The above record has a flow or protocol record labeled (with “stamus.nrd”) as a Newly Registered Domain communication from Stamus’s NRD daily updated lists.
The visualization above is present in the SN-FLOW dashboard (based on Suricata “event_type”:”flow” log data) as part of free and Open Source.
These dashboards that are available in GitHub or as part of SELKS:
https://github.com/StamusNetworks/suricata-analytics/tree/main/kibana/7
Detection Method Three - Larger Flows
Now that we have those 3 major points clarified, we can move on with our detection logic.
First, let's clarify what we mean by “detection” here. In this context, detection is simply marking and/or highlighting NRDs in the communication traffic. Then based on our hunting hypothesis we combine that knowledge with the protocol and alert information that Suricata produces. In some cases there could be no alerts, and that’s ok too.
One point that is important to keep in mind is that after the hunt is successful we should check if traces of such traffic or transactions happened in the past. For example, if we find any TLS certificates, file hashes, or domains, we could use Suricata protocol data to check if these occurred previously regardless of alerting.
We are basing this hunt on the hypothesis / idea that we can highlight information flowing in and out of the organization using Newly Registered Domains and Suricata flow records.
Flow
In this approach we will use purely Flow protocol transaction logging from Suricata.
For a regular Elasticsearch query – based only on Suricata Flow logs (not alerts) – we can use the following command (based on “event_type”:”flow” logs in Suricata):
event_type:flow AND metadata.flowbits:*stamus.nrd*
Which basically says:
- Give me all Flow transactions
- That are to or from NRD
These , in our case, would naturally be any HTTP, DNS, TLS based TCP flows.
The idea here is to see if we have any large (or larger) transfers. Let’s see how we can have a look at that using Kibana functions built into Elasticsearch.
For that purpose we will use a single free, open source, and readily available dashboard called SN-FLOW in SELKS. Don’t worry if you do not use SELKS. As long as you have Elasticsearch and Suricata, you can also import the dashboards via Github. The repository provides 28 dashboards for the Kibana 7.x and Elasticsearch 7.x for use with Suricata IDS/IPS/NSM – Intrusion Detection, Intrusion Prevention, and Network Security Monitoring system.
First, we simply add a filter that states we want to see all “to_client” flows of a certain larger size from Suricata’s “event_type”:”flow” logs:

This shows us 3 such flows:

The specific logs contain more information about that particular flow including size, packet count, TCP/IP flags, flow age, and much more. In our case we have flow.age 0 and about 400kb transfer, which indicates one of the file transfers during the infection:

Here is an example of the Suricata “event_type”:”flow” log from the infection:
{
"_index": "logstash-flow-2023.10.12",
"_type": "_doc",
"_id": "JFMWSIsB7yuKuyCOunpz",
"_version": 1,
"_score": 1,
"_source": {
"app_proto": "http",
"flow": {
"state": "closed",
"reason": "shutdown",
"pkts_toclient": 690,
"start": "2023-10-12T20:09:10.262358+0000",
"pkts_toserver": 350,
"bytes_toclient": 944866,
"end": "2023-10-12T20:09:15.123894+0000",
"age": 5,
"alerted": true,
"bytes_toserver": 21301
},
"type": "SELKS",
"host": "2023-10-12-DarkGate-infection-traffic.pcap",
"proto": "TCP",
"tcp": {
"tc_max_regions": 1,
"tcp_flags_tc": "1a",
"tcp_flags": "1e",
"syn": true,
"psh": true,
"ack": true,
"tcp_flags_ts": "1e",
"rst": true,
"ts_max_regions": 1,
"state": "closed"
},
"geoip": {},
"event_type": "flow",
"dest_ip": "104.21.91.46",
"path": "/var/log/suricata/eve.json",
"flow_id": 1689772642076936,
"src_port": 64642,
"src_ip": "10.10.10.113",
"community_id": "1:ybcPm6gHDFeV6OXdbE+68xisdf8=",
"timestamp": "2023-10-12T20:09:10.185525+0000",
"dest_port": 80,
"metadata": {
"flowbits": [
"FBMproto_0",
"stamus.nrd",
"ET.http.binary"
]
},
"@version": "1",
"@timestamp": "2023-10-12T20:09:10.185Z",
"tags": [
"_geoip_lookup_failure"
]
},
"fields": {
"tcp.tcp_flags.keyword": [
"1e"
],
"metadata.flowbits": [
"FBMproto_0",
"stamus.nrd",
"ET.http.binary"
],
"flow.reason.keyword": [
"shutdown"
],
"flow.state": [
"closed"
],
"type": [
"SELKS"
],
"proto.raw": [
"TCP"
],
"tcp.tcp_flags_tc": [
"1a"
],
"path": [
"/var/log/suricata/eve.json"
],
"flow.reason": [
"shutdown"
],
"event_type": [
"flow"
],
"tcp.state.raw": [
"closed"
],
"community_id.raw": [
"1:ybcPm6gHDFeV6OXdbE+68xisdf8="
],
"proto.keyword": [
"TCP"
],
"tcp.tcp_flags_tc.keyword": [
"1a"
],
"flow_id": [
1689772642076936
],
"flow.alerted": [
true
],
"type.keyword": [
"SELKS"
],
"host": [
"2023-10-12-DarkGate-infection-traffic.pcap"
],
"EveBox": [
1689772642076936
],
"host.keyword": [
"2023-10-12-DarkGate-infection-traffic.pcap"
],
"tcp.state": [
"closed"
],
"dest_port": [
80
],
"tags.raw": [
"_geoip_lookup_failure"
],
"flow.bytes_toclient": [
944866
],
"tags": [
"_geoip_lookup_failure"
],
"tcp.tcp_flags_tc.raw": [
"1a"
],
"metadata.flowbits.raw": [
"FBMproto_0",
"stamus.nrd",
"ET.http.binary"
],
"flow.bytes_toserver": [
21301
],
"app_proto.keyword": [
"http"
],
"tcp.tc_max_regions": [
1
],
"dest_ip.keyword": [
"104.21.91.46"
],
"dest_ip": [
"104.21.91.46"
],
"proto": [
"TCP"
],
"FPC": [
"ip == 10.10.10.113 && port == 64642 && ip == 104.21.91.46 && port == 80 && protocols == tcp"
],
"tcp.syn": [
true
],
"tcp.psh": [
true
],
"tcp.tcp_flags_ts.raw": [
"1e"
],
"tcp.tcp_flags_ts.keyword": [
"1e"
],
"flow.reason.raw": [
"shutdown"
],
"tcp.rst": [
true
],
"tags.keyword": [
"_geoip_lookup_failure"
],
"event_type.keyword": [
"flow"
],
"flow.state.raw": [
"closed"
],
"flow.pkts_toclient": [
690
],
"src_ip": [
"10.10.10.113"
],
"tcp.state.keyword": [
"closed"
],
"community_id": [
"1:ybcPm6gHDFeV6OXdbE+68xisdf8="
],
"tcp.tcp_flags": [
"1e"
],
"app_proto.raw": [
"http"
],
"@version": [
"1"
],
"flow.age": [
5
],
"flow.state.keyword": [
"closed"
],
"src_ip.keyword": [
"10.10.10.113"
],
"path.raw": [
"/var/log/suricata/eve.json"
],
"tcp.tcp_flags.raw": [
"1e"
],
"timestamp": [
"2023-10-12T20:09:10.185Z"
],
"host.raw": [
"2023-10-12-DarkGate-infection-traffic.pcap"
],
"community_id.keyword": [
"1:ybcPm6gHDFeV6OXdbE+68xisdf8="
],
"metadata.flowbits.keyword": [
"FBMproto_0",
"stamus.nrd",
"ET.http.binary"
],
"type.raw": [
"SELKS"
],
"app_proto": [
"http"
],
"dest_ip.raw": [
"104.21.91.46"
],
"src_port": [
64642
],
"flow.start": [
"2023-10-12T20:09:10.262Z"
],
"@timestamp": [
"2023-10-12T20:09:10.185Z"
],
"tcp.ts_max_regions": [
1
],
"src_ip.raw": [
"10.10.10.113"
],
"flow.pkts_toserver": [
350
],
"event_type.raw": [
"flow"
],
"flow.end": [
"2023-10-12T20:09:15.123Z"
],
"tcp.tcp_flags_ts": [
"1e"
],
"tcp.ack": [
true
],
"path.keyword": [
"/var/log/suricata/eve.json"
]
}
}
It is easy to observe in this case that the application layer is HTTP - "app_proto": "http".
We can also easily correlate on Suricata’s native “flow_id” field to see the file transfer checksum from the Suricata related "app_proto": "fileinfo" logs. You can even do it on the command line in CMD with JQ:
jq 'select(.event_type=="fileinfo" and .flow_id==1029375455842075)' eve.json | jq .fileinfo
{
"filename": "Autoit3.exe",
"magic": "PE32 executable (GUI) Intel 80386, for MS Windows",
"gaps": false,
"state": "CLOSED",
"md5": "c56b5f0201a3b3de53e561fe76912bfd",
"sha1": "2a4062e10a5de813f5688221dbeb3f3ff33eb417",
"sha256": "237d1bca6e056df5bb16a1216a434634109478f882d3b1d58344c801d184f95d",
"stored": false,
"size": 893608,
"tx_id": 0
}
{
"filename": "gdlxsh",
"magic": "ASCII text, with very long lines, with CRLF line terminators",
"gaps": false,
"state": "CLOSED",
"md5": "d46ba051ead139b4db7584becbe9ca7b",
"sha1": "582a056fe75f1a375c56c976cefd32063e26633f",
"sha256": "c786fba049049139859c8d552f957780628b437c11af0720c0c13481897b7244",
"stored": false,
"size": 12708,
"tx_id": 1
}
In our case this flow has 2 file transactions and one of them executable.
Historic search / Follow up
One thing we can do is check Suricata’s protocol and file transaction data (“event_type”:”fileinfo”) for historic/previous occurrences in case we’ve seen those files’ checksum anywhere else in the organization.
event_type:fileinfo AND fileinfo.sha256:237d1bca6e056df5bb16a1216a434634109478f882d3b1d58344c801d184f95d
We have one such transfer:


We could also correlate that checksum information to the endpoint protection logs for further investigation.
Conclusion
Some people might still consider Suricata a “legacy” intrusion detection system (IDS), but the data produced by Surcata speaks for itself. It is not only a highly capable IDS but has evolved into an impressive tool for gathering NSM data and full protocol, file transaction, flow, and anomaly logs along with file extraction and PCAP logging. And as we’ve shown at Stamus Networks, Suricata is in fact a powerful foundation on which to build a world-class network detection and response (NDR) system.
We hope this article helps to dispel some of these misconceptions and can help users see the many ways to use and optimize Suricata beyond the basic alerts and signatures.
Additional resources
Further reading on this topic can be found in our free book, “Suricata for Analysts.”” the world’s first practical guide to threat detection and hunting using Suricata.
Please make sure you check out our free and Open Source contributions to Suricata on our Stamus Labs page.
If you wish to be notified when we publish similar content, please subscribe to the Stamus Networks blog.
Finally, to receive near-real time updates, follow us on Twitter, LinkedIn, and Facebook, or join our Discord.