In a previous blog post, we compiled a number of useful JQ command routines for fast malware PCAP network analysis using Suricata. In this post, we decided to use some new PCAPs to share additional command routines that you might find useful.
As before, I often find myself stumbling upon interesting social media posts by other malware researchers. These posts frequently include a PCAP file as an artifact from a malware binary that was detonated in a controlled environment such as a sandbox.
In many cases, I don’t have much extra time, so one of the first questions I need to quickly answer is, “Is this interesting?”. When I come across these files I want to know what they look like from a high level, so I can find out if the research is relevant to me.
There are of a few caveats of course – the PCAP itself or the recording of the network trace might not be long or complete – but in many cases it is good enough to provide ideas for hunting formulas, which I have found to be essential. By devising a quick way to review these PCAPs, which I will share today, I can break up my daily routine while also inviting the possibility to discover something novel.
What tools are needed?
The tools we will use in this exercise are:
- A sample malware PCAP from AnyRun
- Suricata
- Cyberchef
- Proofpoint (PFPT) Suricata ruleset
- JQ
AnyRun - Innovative cloud-based sandbox with full interactive access.
Suricata - is a “high performance, open source network analysis and threat detection software used by most private and public organizations, and embedded by major vendors to protect their assets”. It is an open source tool.
Cyberchef - known as “The Cyber Swiss Army Knife” is an open-source web app for encryption, encoding, compression and data analysis.
ET Pro - “Proofpoint ET Pro is a timely and accurate rule set for detecting and blocking advanced threats using your existing network security appliances, such as next generation firewalls (NGFW) and network intrusion detection/prevention systems (IDS/IPS).” There is also a free version.
JQ - “JQ is a lightweight and flexible command-line JSON processor”. It is readily available and packaged on many OSs.
One of the many powerful features of Suricata is that it can create protocol and transaction logs even in the absence of alerts. These logs include flow, anomaly, alert, protocol, and file transaction logs, plus file extraction and packet capture (PCAP).
Here is a full list and details of what those logs and transactions look like.
The sample PCAP
Let’s have a look at an example. Today we are reviewing a scenario where we have FTP data from publicly available network captures of Agent Tesla exfiltration malware.
During any regular day researchers working for vendors, in academia, or for other organizations publish new findings and reports of malware and behaviors on social media and blogs. Usually, a fast initial analysis (non-detailed) can reveal behaviors and help assess if this specific malware is using a novel network technique of communication or not.
There are many relevant examples that become available daily. I’ve found that reading these isolated samples with the Suricata “-r” option and then reviewing the output has been a very fast way to get a top-level picture of what’s going on. Let’s walk through this process with the above malware example.
Reviewing the PCAP with Suricata
First, we need to conduct a quick initial north-south network analysis with Suricata.
Note: This setup assumes Suricata 7 is installed on the system.
In this specific example we are looking at an Agent Tesla FTP exfiltration snapshot in time:
Here is the command, and you can copy and paste the actual text below:

sudo suricata -S "rules/*.rules" -l logs/ -k none -r 8562c91f-3a62-4e9b-a932-202340761005.pcap ; \
echo "Suricata event types:" ; jq -r .event_type logs/eve.json | sort | uniq -c |sort -rn ; \
echo "Alerts:" ; grep '"event_type":"alert"' logs/eve.json | jq .alert.signature | sort -rn | uniq -c | sort -rn ; \
echo "TLS SNIs:" ; jq 'select(.event_type=="tls")' logs/eve.json | jq .tls.sni | sort -rn | uniq -c | sort -rn ; \
echo "TLS Versions:"; jq 'select(.event_type=="tls")' logs/eve.json | jq .tls.version | sort -rn | uniq -c | sort -rn; \
echo "HTTP Hostnames:" ; jq 'select(.event_type=="http")' logs/eve.json | jq .http.hostname | sort -rn | uniq -c | sort -rn ; \
echo "DNS Queries:" ; jq 'select(.event_type=="dns" )' logs/eve.json | jq .dns.rrname | sort -rn | uniq -c | sort -rn ; \
echo "Filetransfer protocols:" ; jq 'select(.event_type=="fileinfo" )' logs/eve.json | jq .app_proto | sort -rn | uniq -c | sort -rn ; \
echo "Filenames:" ; jq 'select(.event_type=="fileinfo")' logs/eve.json | jq .fileinfo.filename | sort -rn | uniq -c | sort -rn ; \
echo "File magic:" ; jq 'select(.event_type=="fileinfo")' logs/eve.json | jq .fileinfo.magic | sort -rn | uniq -c | sort -rn ; \
echo "FTP commands:" ; jq 'select(.event_type=="ftp" and .ftp.command!=null)' logs/eve.json | jq .ftp.command | sort -rn | uniq -c | sort -rn ; \
echo "FTP users:" ; jq 'select(.event_type=="ftp" and .ftp.command=="USER")' logs/eve.json | jq .ftp.command_data | sort -rn | uniq -c | sort -rn ; \
echo "FTP passwords:" ; jq 'select(.event_type=="ftp" and .ftp.command=="PASS")' logs/eve.json | jq .ftp.command_data | sort -rn | uniq -c | sort -rn ; \
echo "FTP files:" ; jq 'select(.event_type=="ftp" and .ftp.command=="STOR")' logs/eve.json | jq .ftp.command_data | sort -rn | uniq -c | sort -rn
This is the output. Below you will find a breakdown of the findings with explanations. We will skip over the ones already covered in the previous blog. In other words, we will only review the FTP protocol findings from Suricata:

Let’s cover the basics. Below is a list of different unique event fields that could give us a hunting idea during an initial review.
These different unique event fields could give us some hunting ideas during our initial review. These unique protocol and other log event types were all produced by Suricata after reading the PCAP. Any of these Suricata event types can be expanded and reviewed in full detail, however we have them summed up here for the purpose of brevity and for the sake of getting a “bird’s eye” view.
Suricata event types:
44 flow records - “event_type”:”flow”
8 FTP protocol logs - “event_type”:”ftp”
8 DNS protocol logs - “event_type”:”dns”
4 HTTP protocol logs - “event_type”:”http”
4 file transactions - “event_type”:”fileinfo”
3 Alerts - “event_type”:”alert”
1 TLS protocol log - “event_type”:”tls”
1 stats entry log - “event_type”:”stats”
1 Anomaly log - “event_type”:”anomaly”
Three alerts were produced:
Alerts:
1 "ET MALWARE Agent Tesla Reverse Base64 Encoded MZ In Image"
1 "ET MALWARE AgentTesla Exfil via FTP"
1 "ET EXPLOIT_KIT Unknown EK Landing Feb 16 2015 b64 3 M1"
In terms of FTP we have some interesting findings. Here are the FTP commands found in the PCAP. This field is displayed from the “event_type:ftp” protocol log produced by Suricata.
FTP commands:
1 "USER"
1 "TYPE"
1 "STOR"
1 "PWD"
1 "PASV"
1 "PASS"
We also have users logging in via FTP. This field is displayed from the “event_type:ftp” protocol log produced by Suricata.
FTP users:
1 "apama2@aktivos.cl"
The FTP password used by the user above is good quality but clear text. This field is displayed from the “event_type:ftp” protocol log produced by Suricata.
FTP passwords:
1 "HQa.!B(6HMtA"
We have a FTP file transfer. This field is displayed from the “event_type:ftp” protocol log produced by Suricata.
FTP files:
1 "PW_admin-USER-PC_2023_08_25_06_32_17.html"
Below is the full output for that ftp log including FTP application layer data and MAC (ether) addresses:
jq 'select(.event_type=="ftp" and .ftp.command=="STOR")' logs/eve.json

One of the triggered alert logs gives us an interesting view alongside its filetransaction and HTTP application layer protocol analysis inside the same Suricata alert log. Below we have 2 screenshots of part of the alert output.
This is the JQ command to display a specific alert log based on its message:
jq 'select(.event_type=="alert")' logs/eve.json | jq 'select(.alert.signature=="ET MALWARE Agent Tesla Reverse Base64 Encoded MZ In Image")'


We could also perform a very fast review of the extra HTTP, file transaction, and flow logs related to that alert natively via correlation on Suricata’s native flow_id capability. It is very easy to correlate the protocol and network log evidence to any alert when all records of the flow have the same flow identifier.
This is done with this command:
jq 'select(.flow_id==946307653644)' logs/eve.json
You can view a full detailed Suricata alert and file/protocol log example here. It includes:
- HTTP protocol logs - event_type: http
- File transaction log - event_type: fileinfo
- Flow log - event_type: flow
- The alert log itself containing application layer protocol and flow info - event_type: alert
We could also focus on the HTTP protocol details like the http response and http request header of that flow by way of viewing the specific protocol related to that specific flow id.
This is done with this command:
jq 'select(.event_type=="http" and .flow_id==946307653644)' logs/eve.json
Which produces this output:
{
"timestamp": "2023-08-25T08:31:56.441734+0200",
"flow_id": 946307653644,
"event_type": "http",
"src_ip": "192.168.100.5",
"src_port": 49648,
"dest_ip": "195.178.120.24",
"dest_port": 80,
"proto": "TCP",
"pkt_src": "stream (flow timeout)",
"metadata": {
"flowbits": [
"ET.Zberp",
"ETPRO.maldoc.jpg",
"min.gethttp",
"http.dottedquadhost"
]
},
"tx_id": 0,
"http": {
"hostname": "195.178.120.24",
"url": "/apamfile.jpg",
"http_content_type": "image/jpeg",
"http_method": "GET",
"protocol": "HTTP/1.1",
"status": 200,
"length": 351051,
"request_headers": [
{
"name": "Host",
"value": "195.178.120.24"
},
{
"name": "Connection",
"value": "Keep-Alive"
}
],
"response_headers": [
{
"name": "Content-Type",
"value": "image/jpeg"
},
{
"name": "Last-Modified",
"value": "Thu, 03 Aug 2023 20:09:22 GMT"
},
{
"name": "Accept-Ranges",
"value": "bytes"
},
{
"name": "ETag",
"value": "\"3f62d36446c6d91:0\""
},
{
"name": "Server",
"value": "Microsoft-IIS/10.0"
},
{
"name": "Date",
"value": "Fri, 25 Aug 2023 06:32:16 GMT"
},
{
"name": "Content-Length",
"value": "351051"
}
]
}
}
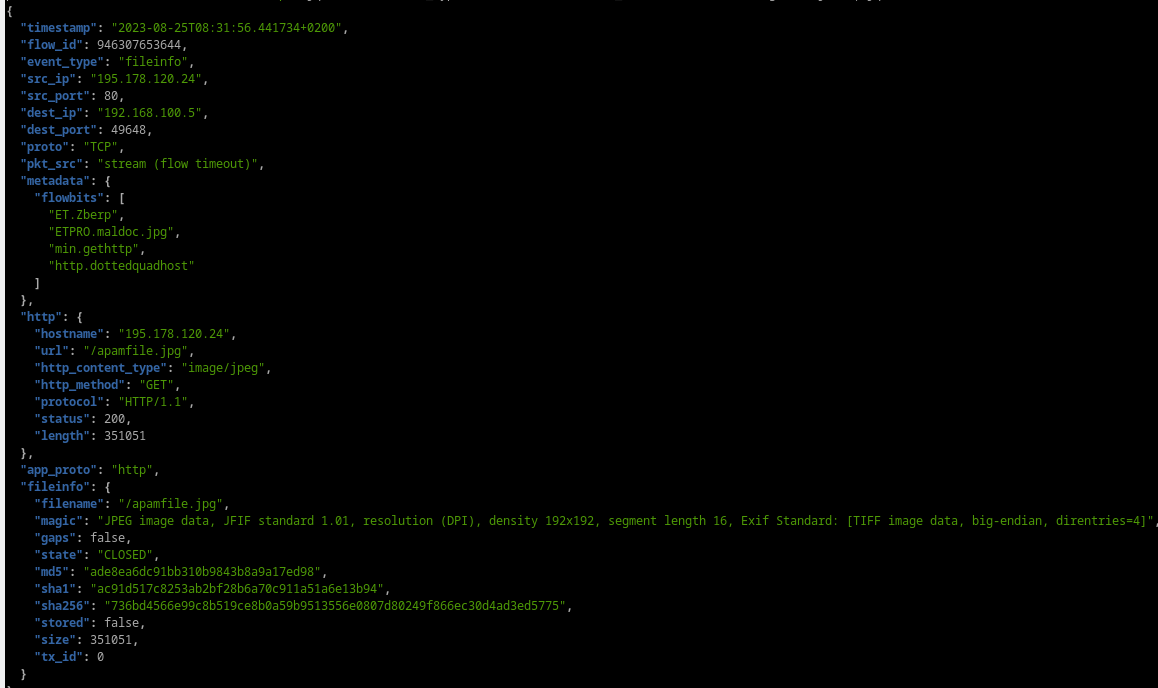
In the same way we can review the filetransaction for that specific alert, which happens over HTTP in this case. This is where we could get information of file magic, filename, file md5/sha256 hashes, and other HTTP details.
To do that, we use this command:
jq 'select(.event_type=="fileinfo" and .flow_id==946307653644)' logs/eve.json
Here is the output:
There are some readily available Open source GUI tools that automatically offer that correlation, such as EveBox and Scirius as part of SELKS. There are some example screenshots below of what they look like for the same alert.
EveBox correlation on Suricata native flow_id:

Part of the HTTP details:

Scirius (as part of the SELKS Suricata threat hunting and ruleset management interface):

Related HTTP details to that alert as part of the HTTP tab in the alert protocol evidence:

This entire investigation can happen in just a couple of minutes, giving us a very fast, high-level view of the exfiltration techniques and north-south network communication with Suricata.
In this case we have a reverse encoded base64 executable, so we can add the switch “--set outputs.9.file-store.force-filestore=yes” to our Suricata run command (from the beginning of this blog post) for the file to be extracted and further analyzed if needed:
ls -lh logs/filestore/73/736bd4566e99c8b519ce8b0a59b9513556e0807d80249f866ec30d4ad3ed5775
-rw-r--r-- 1 343K Sep 21 16:57 logs/filestore/73/736bd4566e99c8b519ce8b0a59b9513556e0807d80249f866ec30d4ad3ed5775
file logs/filestore/73/736bd4566e99c8b519ce8b0a59b9513556e0807d80249f866ec30d4ad3ed5775
logs/filestore/73/736bd4566e99c8b519ce8b0a59b9513556e0807d80249f866ec30d4ad3ed5775: JPEG image data, JFIF standard 1.01, resolution (DPI), density 192x192, segment length 16, Exif Standard: [TIFF image data, big-endian, direntries=4], baseline, precision 8, 549x294, components 3
This is a very basic, although very useful, quick analysis of a PCAP trace from a live malware sandbox detonation to give us an idea of what is happening in this example. Keep in mind that these are PCAPs with a short timespan, so the idea here is to see and explore the details in that specific timeframe of the malware process. However, this gives us plenty of information and ideas for structured and unstructured hunting recipes or queries, which in turn can be automated. For example, we could hunt for clear text SMTP, FTP transactions, obfuscated executables in images, the SMB/KRB5 user and hostnames that are present during malware proliferation and investigation, and other similar results.
The commands showcased above and from the previous blog post can also be put in a script to give us a quick overview of the major pieces of information that are essential for a fast initial review of specific malware: communication points, usernames, hostnames, email, TLS certificates, OS levels, file magic/names, and file transactions and flows.
The logs reviewed are standard JSON. There is also, naturally, a possibility to review full and summarized details of the logs in any graphic interfaces as Grafana (free dashboards for Suricata), Kibana (free dashboards for Suricata ), Splunk (free Stamus app for Suricata) and others. The purpose of these blog posts however is to do these reviews fast and easy on the command line to get an initial view (in less than 1 minute) of the network communication.
Conclusion
Some people might still consider Suricata a “legacy” intrusion detection system (IDS), but at Stamus Networks, we don’t see it that way. It is not only a highly capable IDS but also an impressive tool for gathering NSM data. And Suricata is, in fact, a powerful foundation on which to build a full-featured network detection and response (NDR) system.
Many Suricata users remain unaware of how they can use and optimize Suricata beyond the basic alerts and signatures. For more JQ tips and tricks you could also review this video recording of a webinar by Open Information Security Foundation (OISF). Additionally, further reading on this topic can be found in our free book, “Suricata for Analysts.”” the world’s first practical guide to threat detection and hunting using Suricata.
Make sure to subscribe to the Stamus Networks blog, because we will be continuing this series with two more follow-ups detailing how to perform east-west SMB and KRB5 analysis using the same method. You can also receive updates by following us on Twitter, LinkedIn, and Facebook, or by joining our Discord.