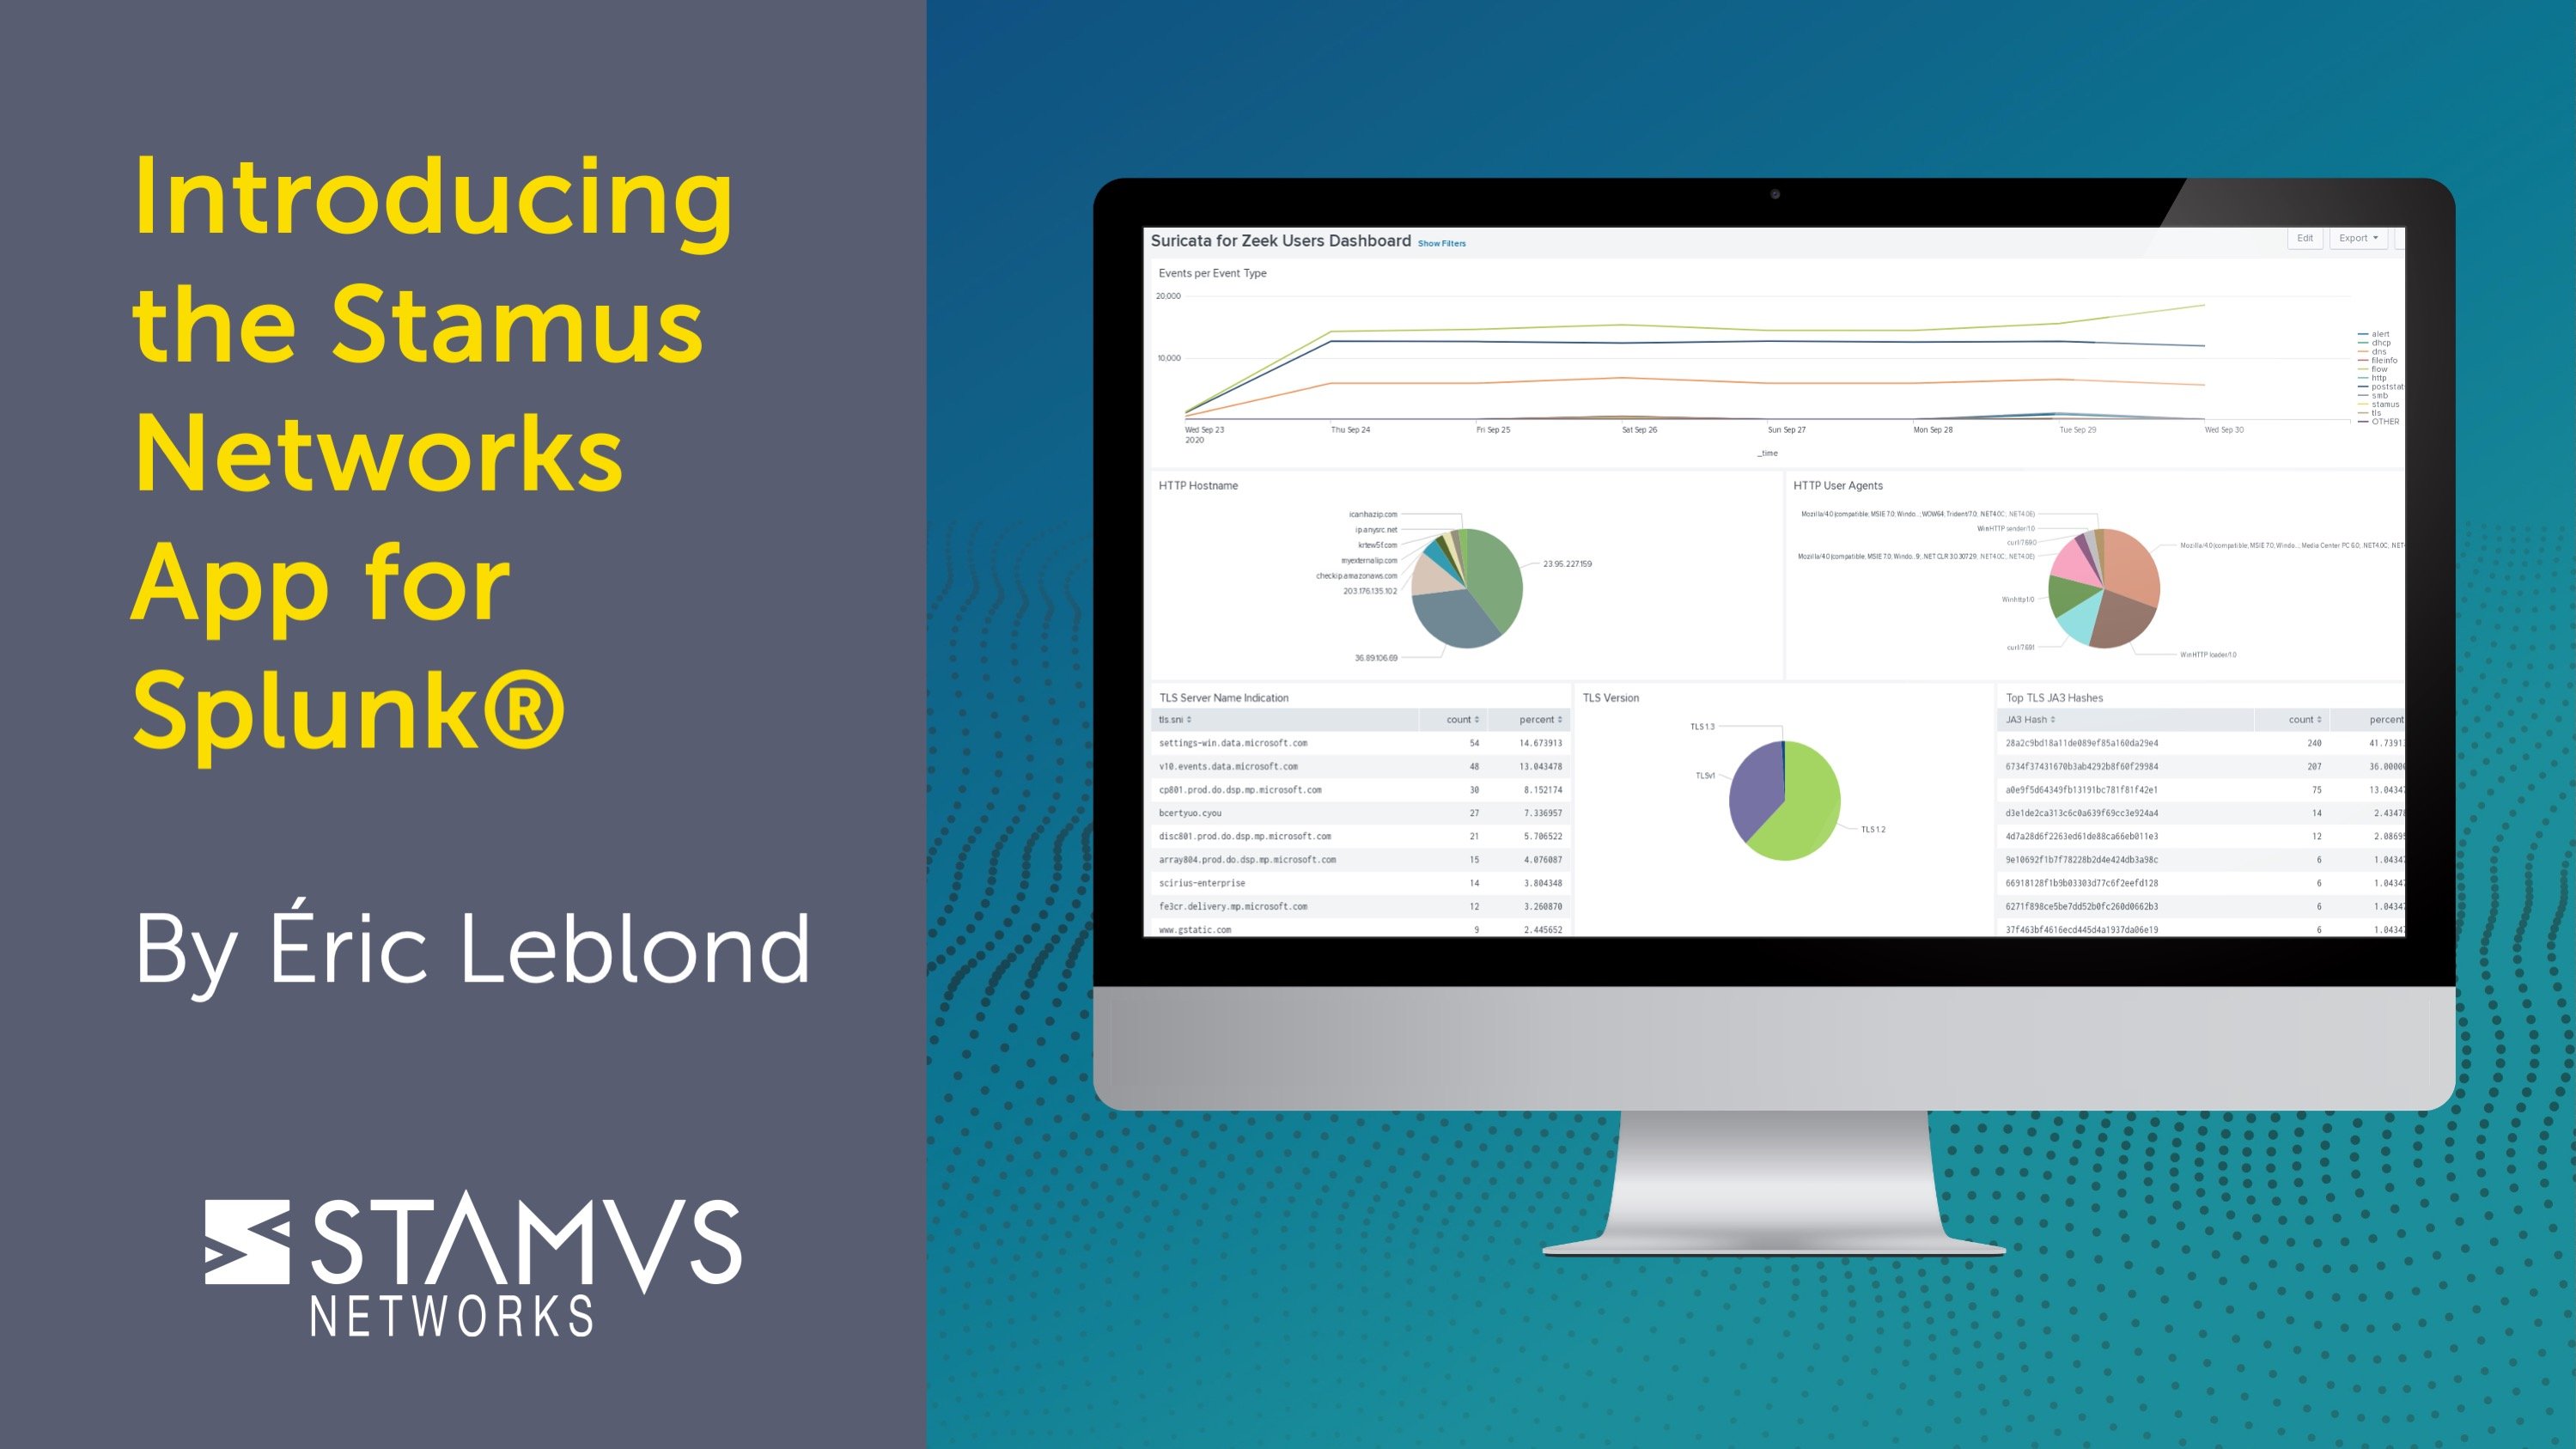
This week we announced the new Stamus Networks App for Splunk®. You can read our press release here >>
Background
For many years, users of Stamus Networks network-based threat detection and response (NDR) solution, Stamus Security Platform (SSP) (formerly known as Scirius Security Platform), have been able to view and analyze their SSP events and logs with Splunk. In fact, the majority of our customers are Splunk users and have integrated our probe data with their instance of Splunk. Our customers tell us that the enriched JSON data from Stamus Security Platform delivers valuable context beyond traditional IDS and NSM data.
Since this initial integration with Splunk, Stamus Networks has advanced SSP to include an aggregated host data feature (described below). And we recently introduced the Scirius Threat Radar (now an SSP feature at the Stamus NDR license tier), an asset-centric approach to NDR that allows the analyst to more clearly understand the threat impact and accelerate incident response. With these advancements, it has become clear that our integration with Splunk needed to move beyond that direct probe connection.
SSP’s unique host data provides a snapshot view of the network by aggregating information about the services and agents (HTTP, TLS, SSH) identified over time on monitored IP addresses across the entire network. This consolidated view of the network activity is maintained inside SSP and is only available via the system’s REST API. Our users have found this information to be really powerful for network discovery and in providing context for incident response. So, we decided to develop a Splunk App -- complete with ready-to-use dashboards, reports and advanced queries -- that will expose all the power and unique perspectives of SSP to Splunk users.
We also had another really important motivation. With our company roots planted firmly in the Suricata open source community, we also wanted to offer ready-to-use dashboards and reports that will expose the IDS and NSM data being collected by Suricata sensors and help those with large Suricata deployments become more productive.
So, we created the Stamus Networks App for Splunk with support for Stamus Networks commercial solutions as well as open source Suricata sensors.
Features
Listed below are the currently available dashboards and reports in the initial release:
Dashboards for Scirius Security Platform
- Stamus Networks Dashboard
- Stamus Networks IDS Dashboard
- Stamus Networks IP Investigation Dashboard
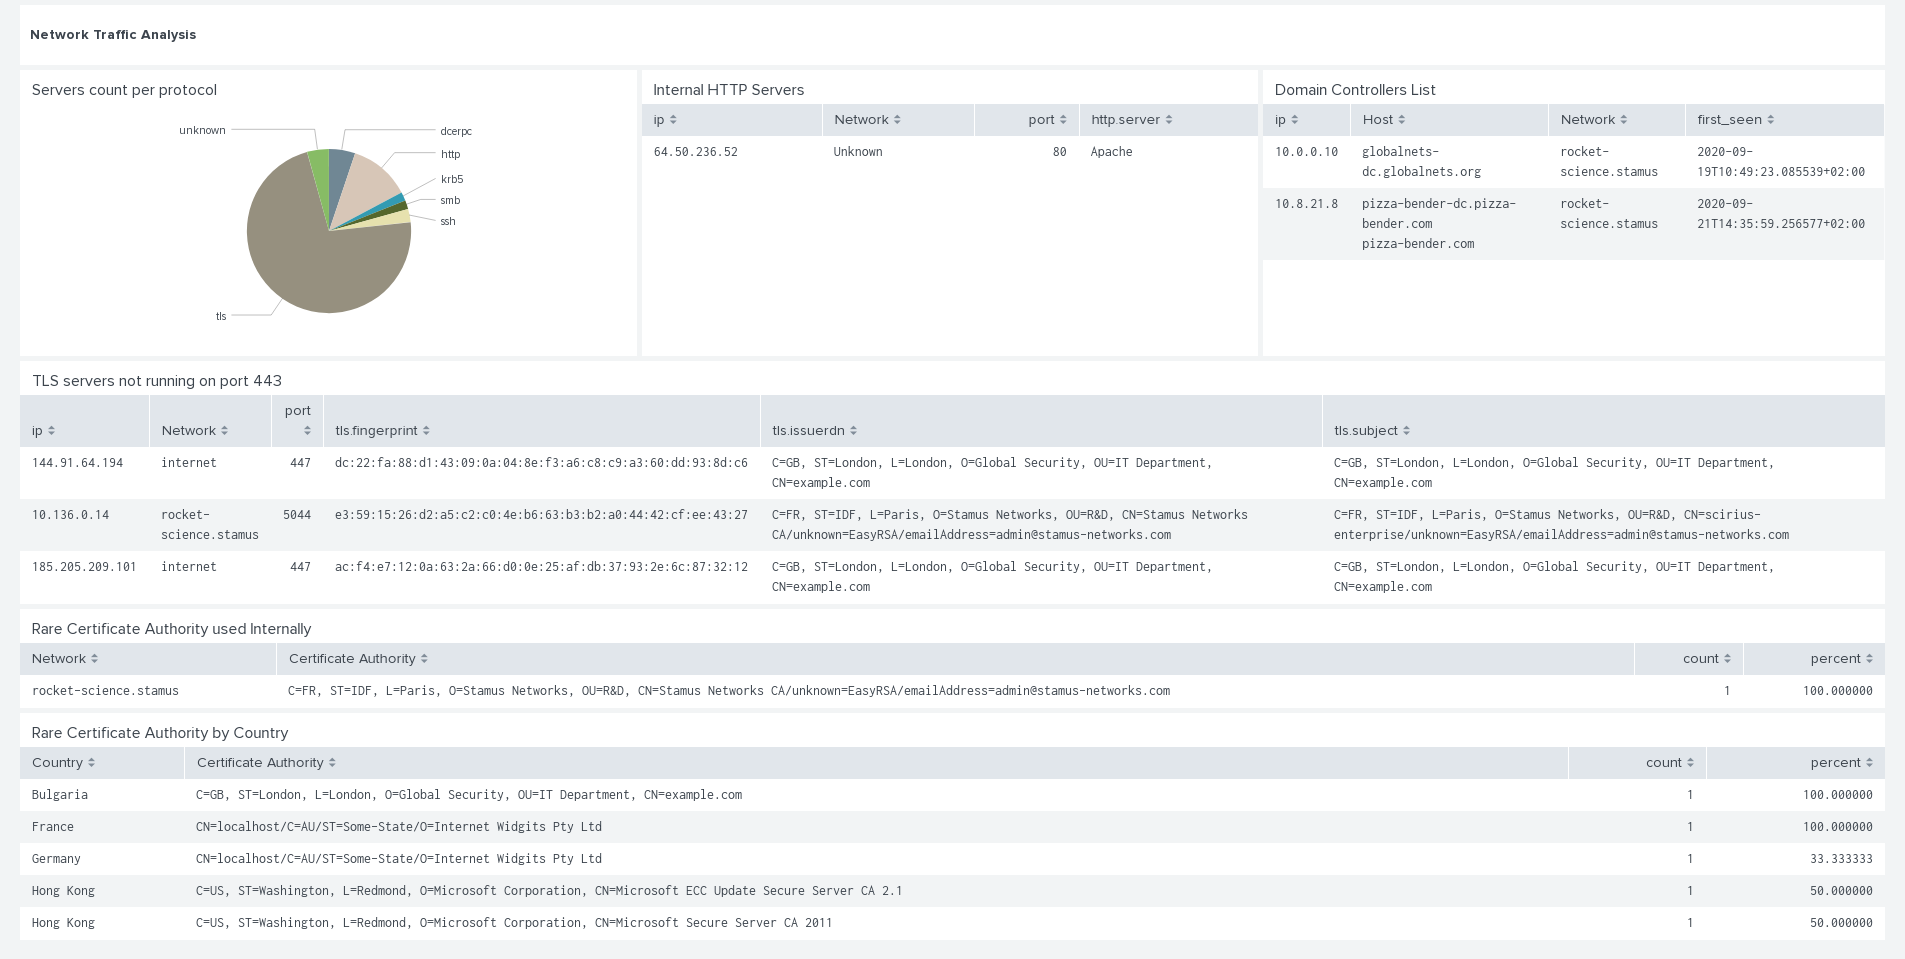
- Stamus Networks NTA Dashboard
- Stamus Networks Threat Radar Dashboard
Dashboards for Suricata Sensors
- Suricata Admin Dashboard
- Suricata Events Dashboard
- Suricata for Zeek Users Dashboard
- Suricata for IDS Dashboard
- Suricata for IP Investigation Dashboard
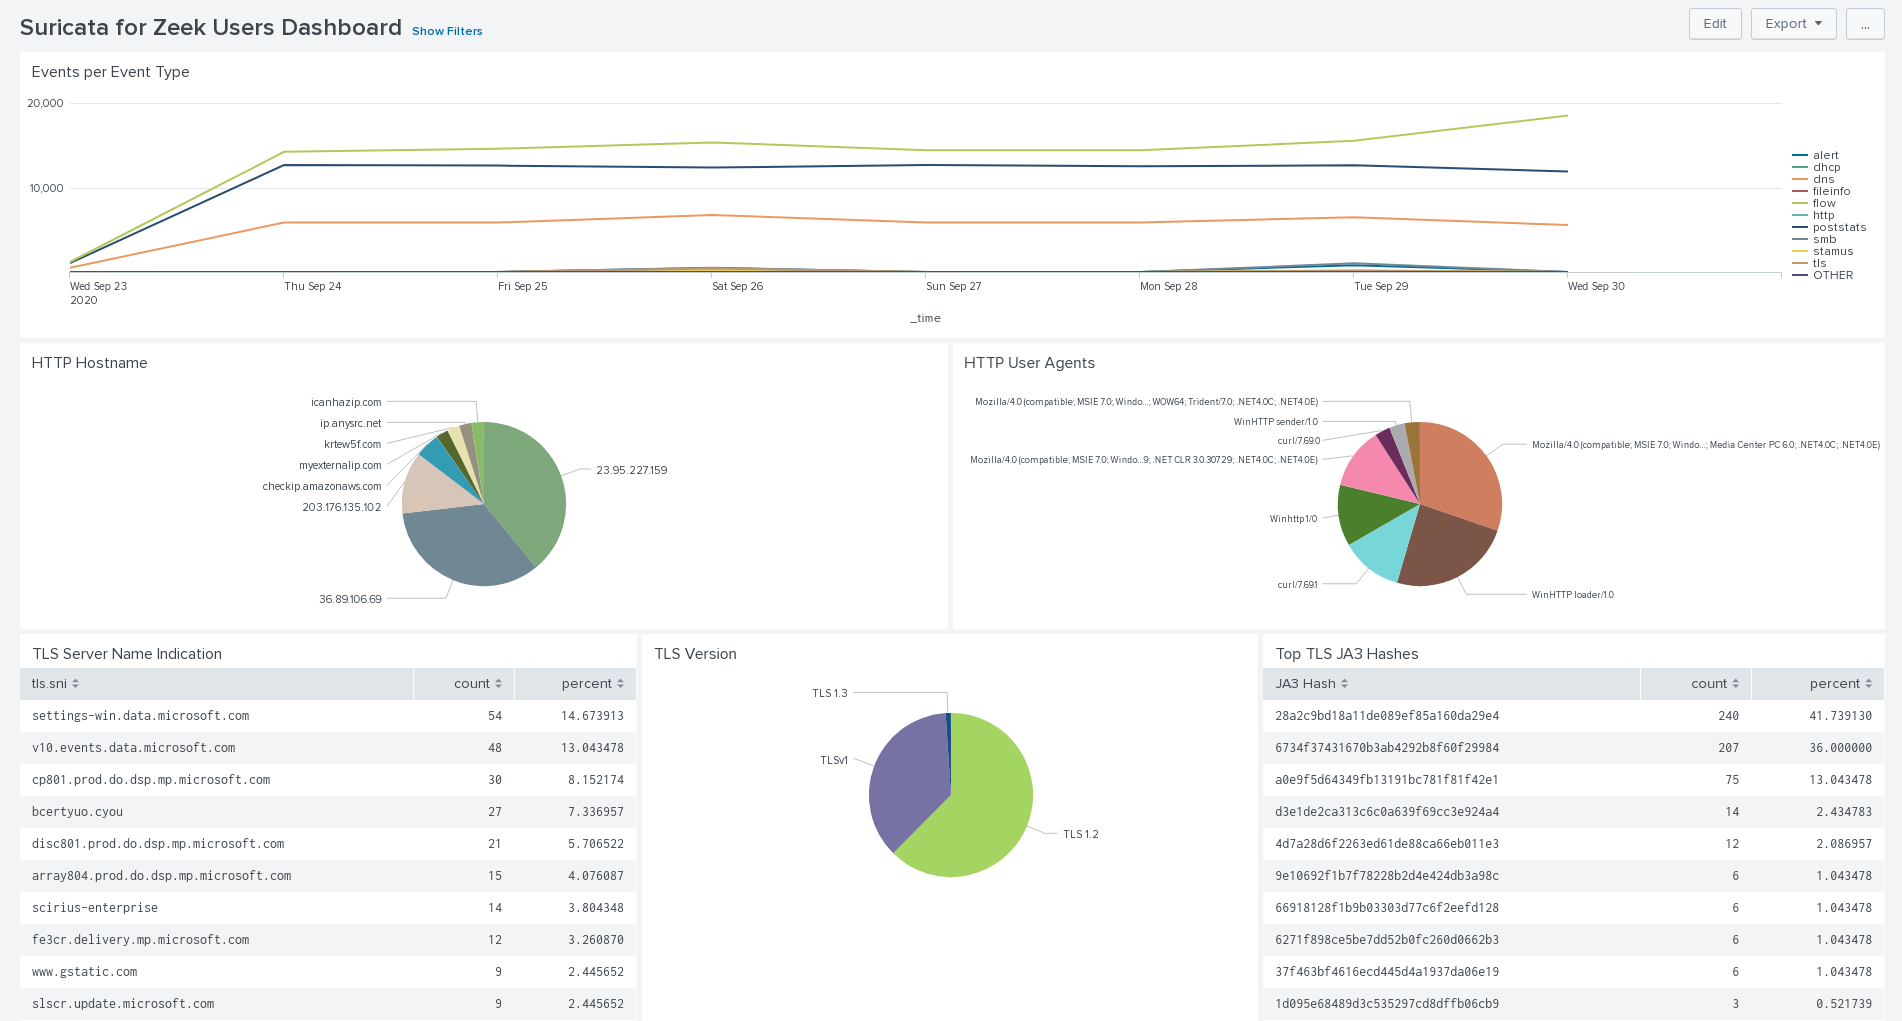
The Suricata for Zeek Users Dashboard displays network security monitoring features of Suricata sensors and contains things such as TLS information or user activity via SMB or kerberos (see the next two screenshots).
This first screen displays a timeline of events for all protocols logged by Suricata and shows HTTP and TLS information.
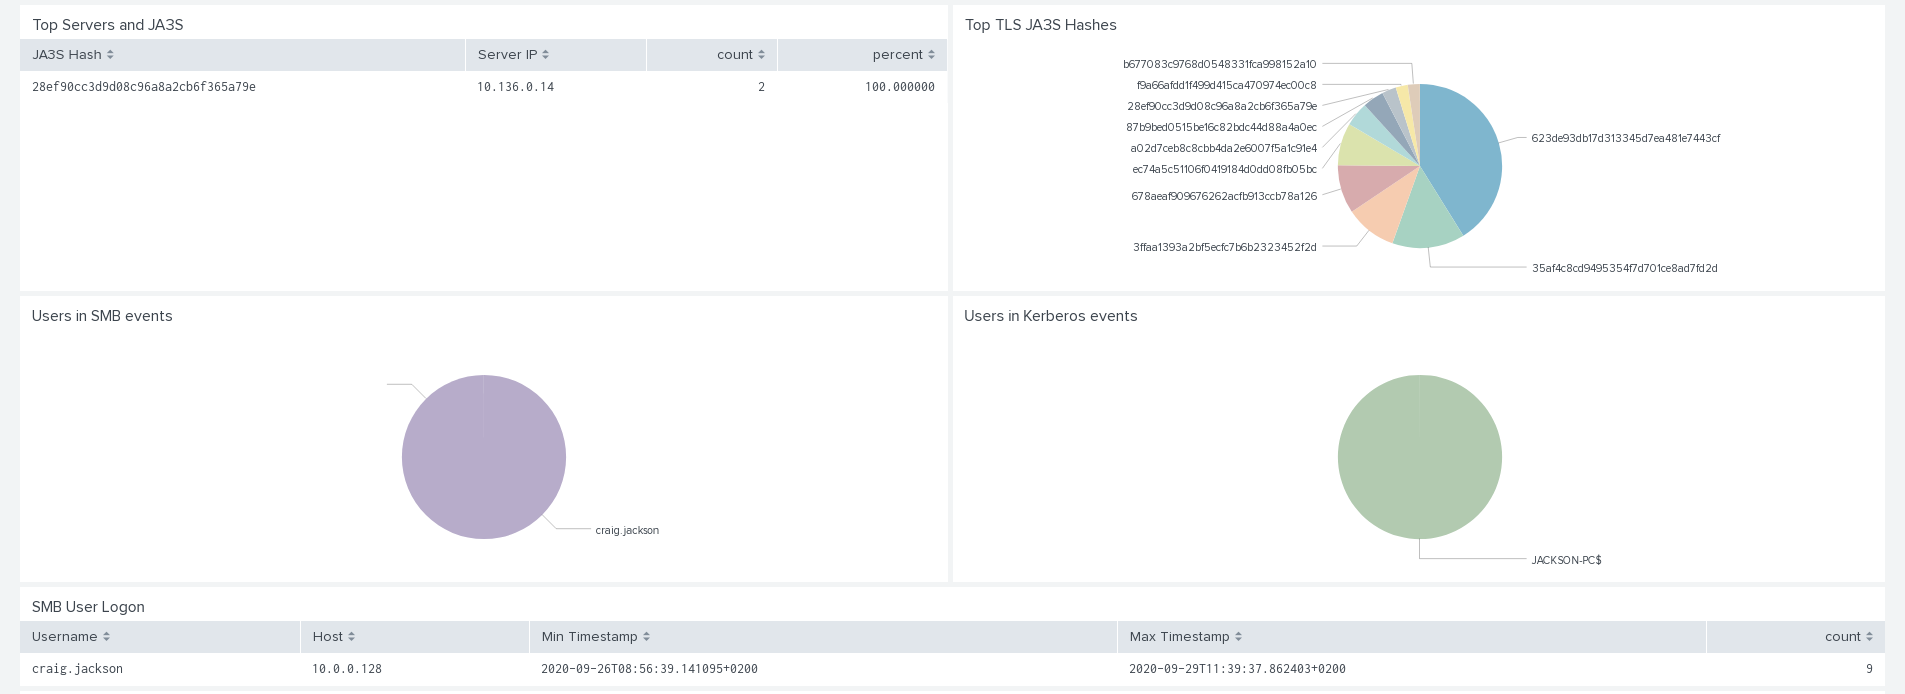
In the screenshot below we can see the JA3 and JA3S information that are important for analyzing TLS-encrypted traffic. You can also see here how Suricata can extract usernames from protocols like Kerberos or SMB.
The Stamus Threat Radar Dashboard features analysis of Stamus threat events, which are high fidelity alerts mapped on the cyber kill chain:
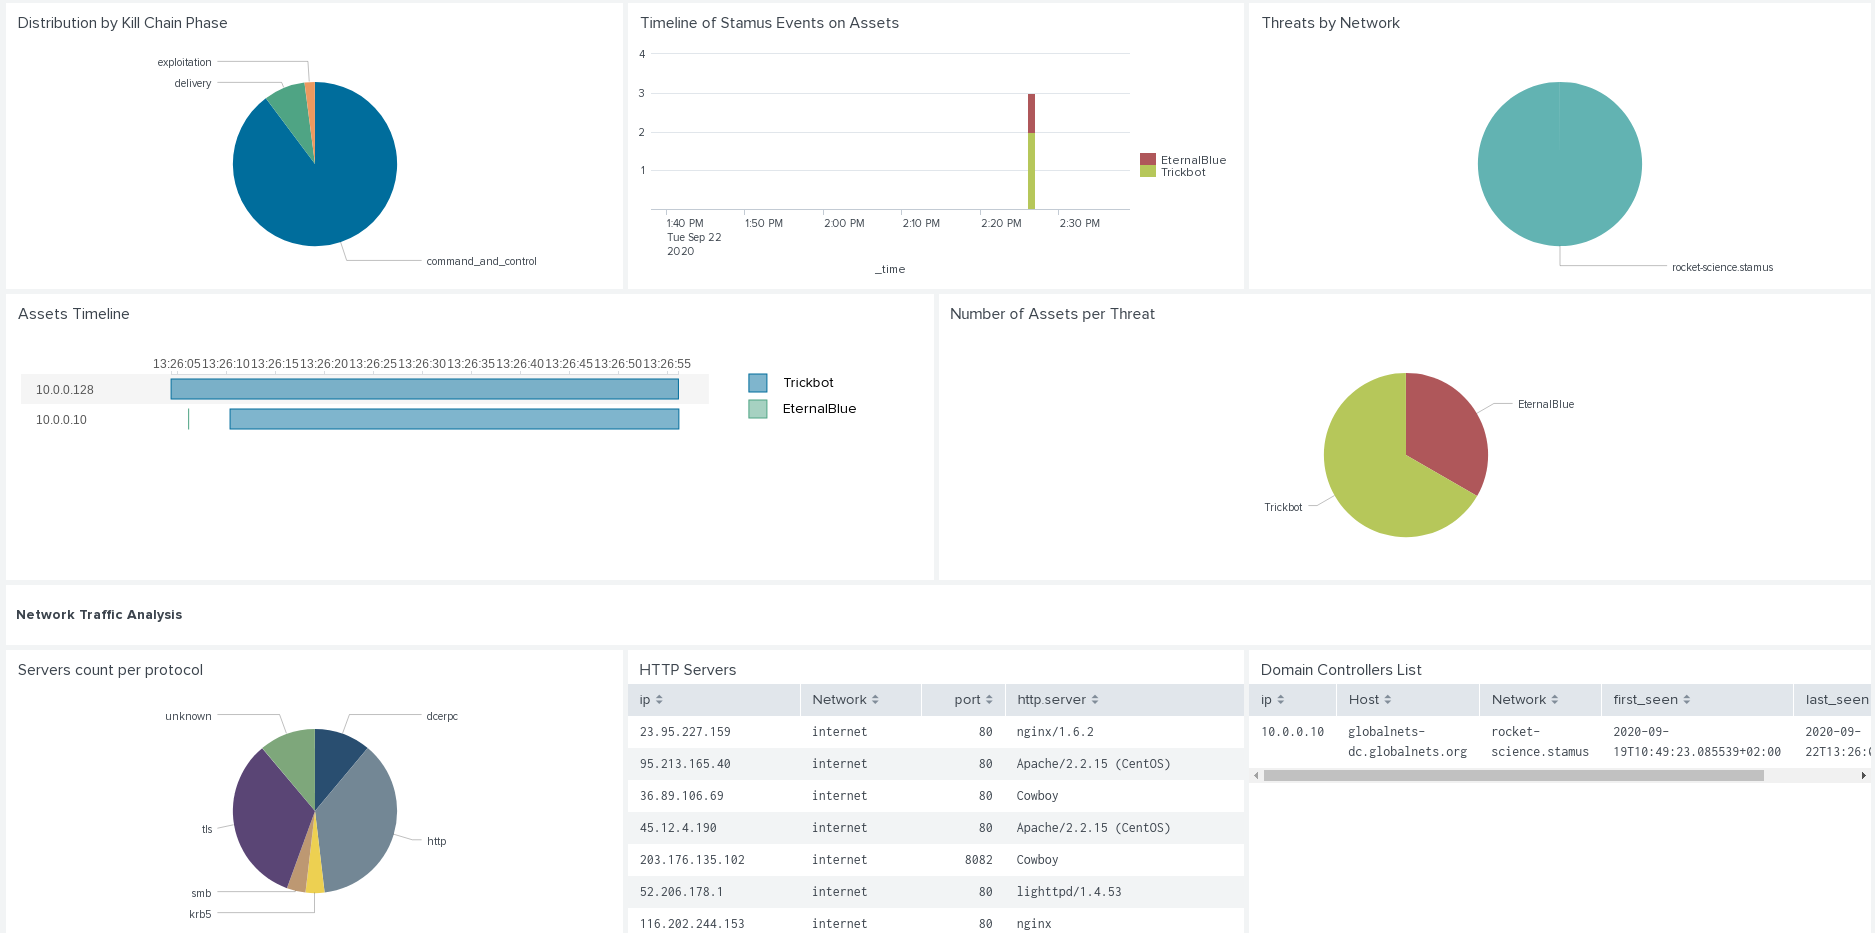
This last screenshot displays the result of SSP analysis of a pcap from Malware Traffic Analysis. We can see two threats -- Trickbot and Emotet -- and a chain of events with Trickbot on the first IP, then Emotet seen on a second one (probable lateral movement) followed by Trickbot on the second IP. And If we look closely at the second IP, we see that it appears in the list of domain controllers identified by SSP. So we have the full movie shown here with an initial compromise, subsequent lateral movement and then the domain controller that finally becomes owned by the attacker.
Earlier I mentioned the Host Insights feature that provided the motivation for us to develop the Splunk App. I would be remiss if I did not point out one of the most interesting features of the host ID connector: the ability to filter regular events. A few examples follow.
For instance, to display all alerts where an HTTP server running Apache software is involved, you can simply enter the following query:
event_type="alert" | snhostfilter filter="services.values.http.server=Apache"
And because SSP keeps historical data in a concise format, the snhostfilter queries on SSP REST API get time-independent data in a short format (and a very fast query) and this is de-correlated from the data used in the search.
Cross source requests may also be performed, allowing powerful correlation among data sources. For example, the following query displays information on top client IP and URI for requests issued from IP addresses where user john.doe connected:
source="nginx.log" | snhostfilter filter="username=john.doe" keys="clientip" | top clientip, uri
Another interesting command is the snhostsearch command that allows you to search in the host ID database. For example, to list all HTTP services in the internal network and return the least-frequently used servers, one can use:
| snhostsearch filter="services.values.app_proto=http net_info.agg!=internet"| rare "services{}.values{}.http.server"
All these features are used in the Stamus Networks dashboards to give meaningful insight into the organization’s network.
The above request is used in the Stamus Networks STR Dashboard (see below) to display indicators and key elements of the network:
In addition to the above mentioned dashboards, the app provides a number of read-to-use reports:
Reports
- Assets under Attack
- Domain Controllers List
- HTTP Servers
- HTTP Servers not running on port 80
- New Services on Known Hosts by Stamus Networks
- Recent services by Stamus Networks
- TLS Servers
- TLS servers not running on port 443
- Threats by Network
The data presented by the Stamus Networks App for Splunk adheres to the Splunk Common Information Model (CIM). This consistent structure and naming convention allows Splunk to normalize the treatment of data from multiple sources for maximum efficiency at search time.
We are excited to offer this Stamus Networks App for Splunk to users of SSP and for the greater Suricata community. Please check it out (https://splunkbase.splunk.com/app/5262) and let us know what you think.