This week in our series on guided threat hunting, we are focusing on locating internal use of Dynamic DNS using Stamus Security Platforms Enriching Hunting Interface. This type of activity could signal an internal security policy violation or, in some cases, the presence of malware communicating with a command-and-control server. Identifying this type of traffic using a guided hunting filter can help put a stop to the activity before it puts the organization at risk.
Stamus Security Platform (SSP) automatically detects and identifies threats on the network, and presents security teams with incident timelines and extensive context for each threat. Many organizations take advantage of advanced SSP features and take an even more proactive approach to their defenses. When this is the case, they might task a security analyst with hunting for specific threat types, anomalous activity, or suspicious behaviors. To do this, they can use the Stamus Enriched Hunting Interface.
This interface provides security practitioners with over 100 ready-to-use guided threat hunting filters, including various filters for policy violations, that they can use to investigate, classify, escalate, and automate vast amounts of event data, alerts, and contextual metadata. For a more detailed look at the Enriched Hunting Interface, read the blog article titled, “Introduction to Guided Threat Hunting”.
What is internal use of dynamic DNS?
Similar to typical DNS servers (which we covered in last weeks blog “Hunting for Use of Foreign Domain Infrastructure with Stamus Security Platform”), dynamic DNS (DDNS) is a protocol for changing domain names into IP addresses. The key difference between the two is that DDNS simplifies the connection process by mapping between the hostname and the IP address without needing to manually make changes.
With DNS, infrastructures must be updated manually. For many organizations, this is not an issue because IP addresses do not undergo frequent changes. DDNS, on the other hand, is convenient in environments where record updates are common. The downside to DDNS is that attackers can use DDNS services to change the IP addresses of their command-and-control servers or for payload distribution. This is why maintaining visibility into the network and knowing when any DDNS usage is occurring is important. It could mean that an employee is using an unauthorized DDNS server (which is a security policy violation for many organizations) or that an attacker is leveraging DDNS for malicious purposes. .
Identifying internal use of Dynamic DNS using SSP
When it comes to threat detection, Stamus Security Platform (SSP) does most of the work for you. With Declarations of Compromise™, it definitively identifies serious and imminent threats. However, no system can automatically detect everything. That’s why SSP logs every possible indicator of compromise – otherwise known as “alerts”. These alerts can be used to create a trail of evidence in an incident investigation. Additionally – as seen in this series – they can also be used to inform a guided hunt for specific threat types or other unwanted activity.
So let’s take a look at the current alerts on our system:
In the past 24 hours, we have had about 761 thousand alert events which have triggered hundreds of thousands of results. This is in addition to protocol, flow, and file transaction logs as well as Host Insights for 14,000 network endpoints/hosts.

The Hunt for internal use of dynamic DNS
To begin this hunt, we first have to select the relevant filter from the drop down list. Since there are over 100 guided hunting filters, we need to narrow the list down and find the filter we want.
For this hunt we will search for “dynamic” and then select the filter titled “policy: Dynamic DNS requests”.


It is important to note that SSP Enriched Hunting also provides additional organization-specific context. Users can filter for queries from various departments or user groups within the organization, allowing them to hyper-focus on specific areas without having to aggregate events or organize IP addresses to find specific users or departments. For example:

508 alerts in the given timeline might seem like a lot, but this is still useful and discloses very interesting results in terms of domain requests.
As part of one of many enrichment processes, the Stamus Security Platform automatically breaks down any http/dns/tls domains within those network protocol records into its subforms - Subdomain, Domain, TLD, Host , and Domain without TLD.

But there is still work left to do. Let’s move on.
To get a better understanding of what is going on here, we want to see which users are currently logged in and and get a list of their machines. It is important to know who the client and offending hosts are and if there is any additional information about them seen on the network. Specifically, we need to see which services are running on the offender’s host.
To do this we can use Host Insights - a very powerful feature included with the Stamus Security Platform. Host Insights tracks over 60 security-related network transactions and communication attributes of a host. This provides a single place to view many aspects of the network activity relative to a given host, such as network services, users, or TLS fingerprinting forensic evidence.
We can click the “Hosts” tab on the left hand side panel and be transferred from the actual events logs to the Host Insights screen.
From there, we can take a look at which users are currently logged in.
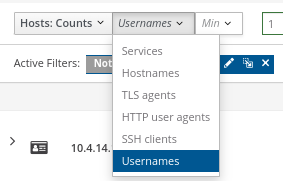
By filtering down to only logged in users, we can see 3 hosts and 3 events to work with. Considering we started with 761 thousand total alerts, 508 dynamic DNS events, and over 14,000 hosts/endpoints, I would say this is a much easier number to investigate.

Now we can look into each host and identify the user and view the network protocol log evidence. We want to review the specific information gathered in Host Insights such as the application protocol usage, user agent’s hostname, encrypted analysis, a timeline of events, and more.
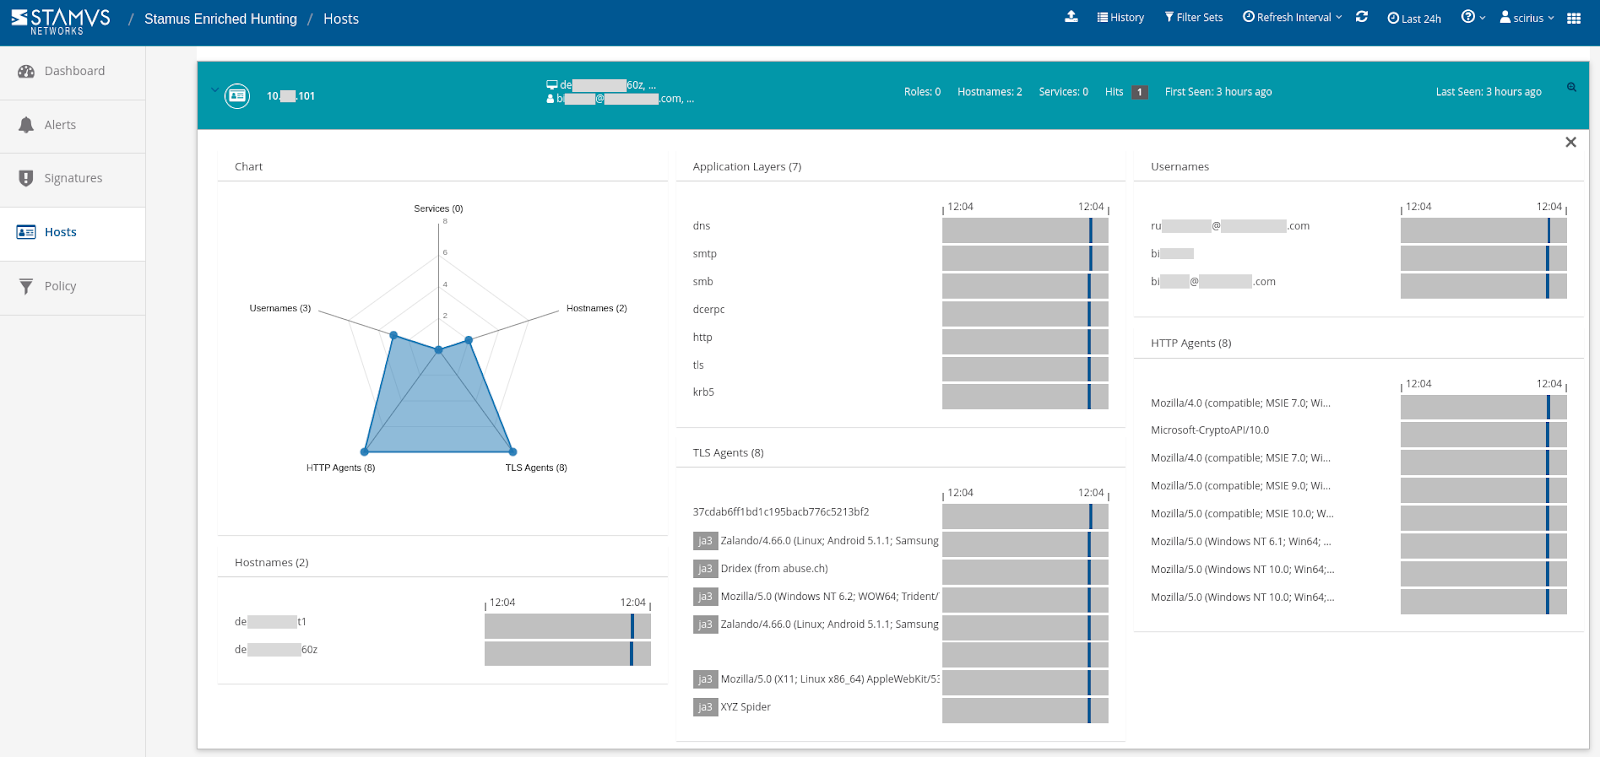
Evidence for Incident Response
With just a few clicks, We are able to view two important sets of evidence:
- 1. The associated network protocol transactions and flow logs
- 2. Host Insights - a single screen for reviewing 60+ network activity attributes collected for every host
The generated events are already enriched by SSP to include important metadata like DNS records, TLS protocol data containing certificate names, fingerprint JA3/JA3S, connection flow sizes, http user agent, http host, request body, status codes, file transaction info, and more.
We have located the initial users and stations of the public dynamic DNS infrastructure.
We also have located the initial IoC, including the frequency and location of its presence in the network.

We now need to identify what was queried from that public infrastructure and which user or station did it first. To do that we can use a very useful feature in the Stamus Security platform called “Sightings”. This will give us the ability to pinpoint the first time a piece of metadata like a domain, TLS certificate, HTTP host/user agent, JA3, JA3S, file checksum etc has been first seen in the enterprise. For this purpose we will switch off all Alerts and leave only the “Sightings” turned on.


TLS Sessions
We need to have a look at the discovered offending TLS IoC and list all the places we have seen it in HUNT. To do this, all we have to do is select it to zoom in on the data.


From here, we can select a specific event and further review the supplemented network protocol and connection logs evidence. This information not only provides context for our current hunt, but also allows us to use the available metadata to create other hunting filters for future use.
Security analysts can use any piece of metadata to create simple or complex filters for things like wildcarding, negation, or inclusion. You can even include multiple fields for fast drill down capabilities. All domains, TLS SNI, IP addresses, HTTP hosts, and more can easily be checked with an external threat intelligence provider such as Virus Total.
Armed with the above information and evidence, a threat hunter has enough information to generate an Incident Response ticket. However, there are still two tasks left to complete:
- 1. We do not want to have to repeat this exact same process again in the future, so we need to set up classification and auto-escalation for future occurrences.
- 2. If anything like this has happened before, we want it to be found and escalated with all the associated evidence - all based on historical data.
Classification
In order to streamline the event review/triage process in the future, an experienced analyst can choose to tag/classify the events associated with this filter By doing so, SSP will tag future events that match the filter criteria as “relevant” or “informational,” depending upon the analyst’s selection. These tags can be used to automate event review/triage and make it easier for a less-experienced analyst to identify events that are relevant for manual review.
To do so, the analyst selects the Tag option from the Policy Action menu on the right hand side menu. This action will cause SSP to insert a tag into each event record as shown below:
This allows the analyst to easily filter out or search for them in any SIEM (Chronicle, Splunk, Elasticsearch, etc) or data lake using that tag.
It also allows for easy filtering out of those events in the Stamus Enriched Hunting GUI by switching to “relevant” only classified events.

Escalation and Automation of this Hunt
To set up an automation which causes SSP to escalate past and future occurrences, we can create a Declaration of Compromise (DoC) event from the Policy Actions drop down menu on the right hand side panel in the Stamus Enriched Hunting Interface.

The next step is to add some explanation about the type of threat. This also gives us a chance to provide informational context and helps convey knowledge to colleagues

Select options to generate events from historical data and generate Webhook notifications.

Just like that, the hunt and all related activities are complete. Any past or future generated events from that automation will then be further auto-classified and escalated to the desired response process - via SOAR playbook, chat notification, or incident response ticket.
Conclusion
The post-hunt activities completed in this example are just the tip of the iceberg when it comes to the automation and escalation capabilities of Stamus Security Platform. To learn more about these features and how to implement them, read our article titled “After the Hunt”.
To learn more about Stamus Security Platform (SSP) - a complete NDR package and see the enriched hunting interface for yourself, click the button below and schedule a live demo.