Stamus Networks is proud to announce the availability of version 1.0, nicknamed "glace à la vanille", of Amsterdam, our container based ready to use Suricata IDS. Amsterdam is a fully web managed software appliance that is using Docker to provide:
- Network Intrusion Detection and Network Security Monitoring via Suricata
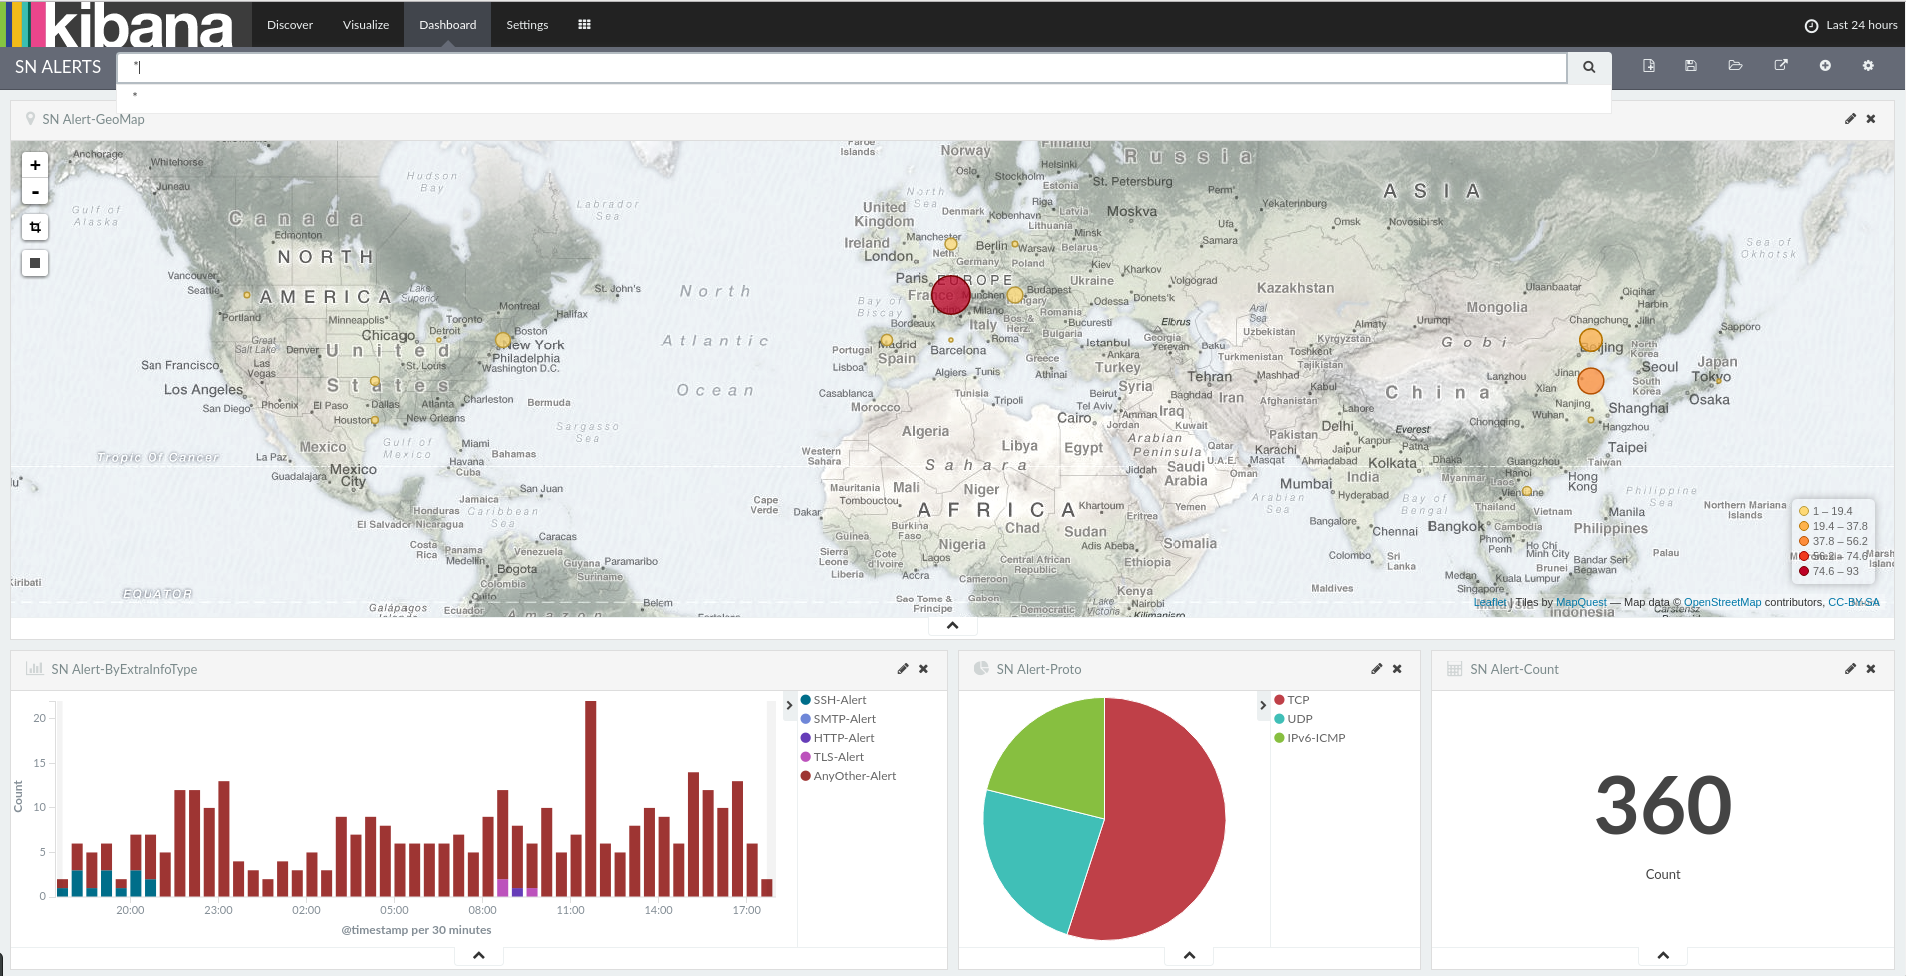
- Log storage and analysis via the Elastic stack: latest Logstash, Elasticsearch and Kibana are part of the Amsterdam
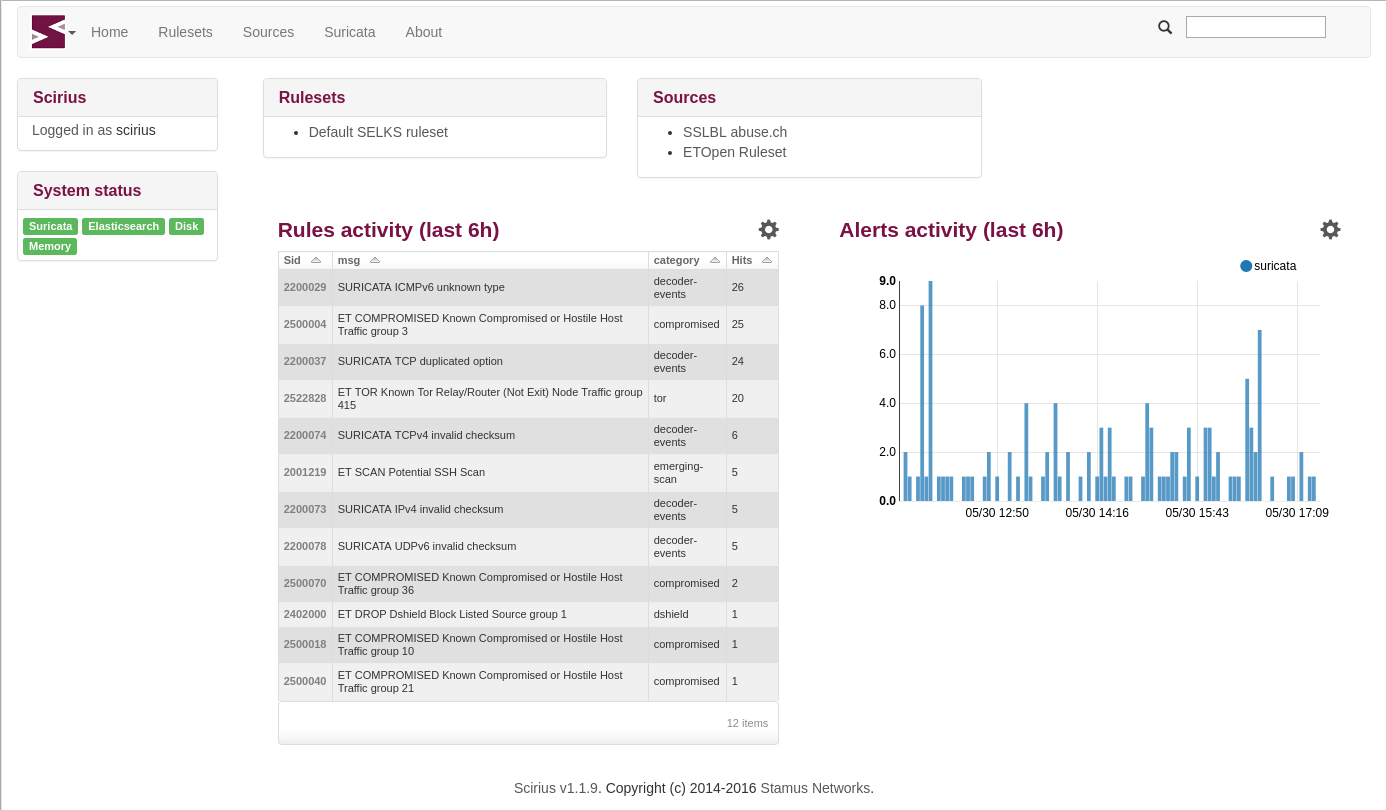
- Suricata ruleset management and basic reporting via Scirius our web interface
- Alerts listing and acknowledgement via Evebox
Each component is running in its own container and Amsterdam is using by default the official image on Docker Hub. This guarantees you fast update and heavily tested software. The orchestration of the different containers is done via Docker compose but all the details are hidden to you and Amsterdam should be your only interface in daily usage.
Installation is just a few commands:
pip install amsterdam
amsterdam -d ams -i wlan0 setup
amsterdam -d ams start
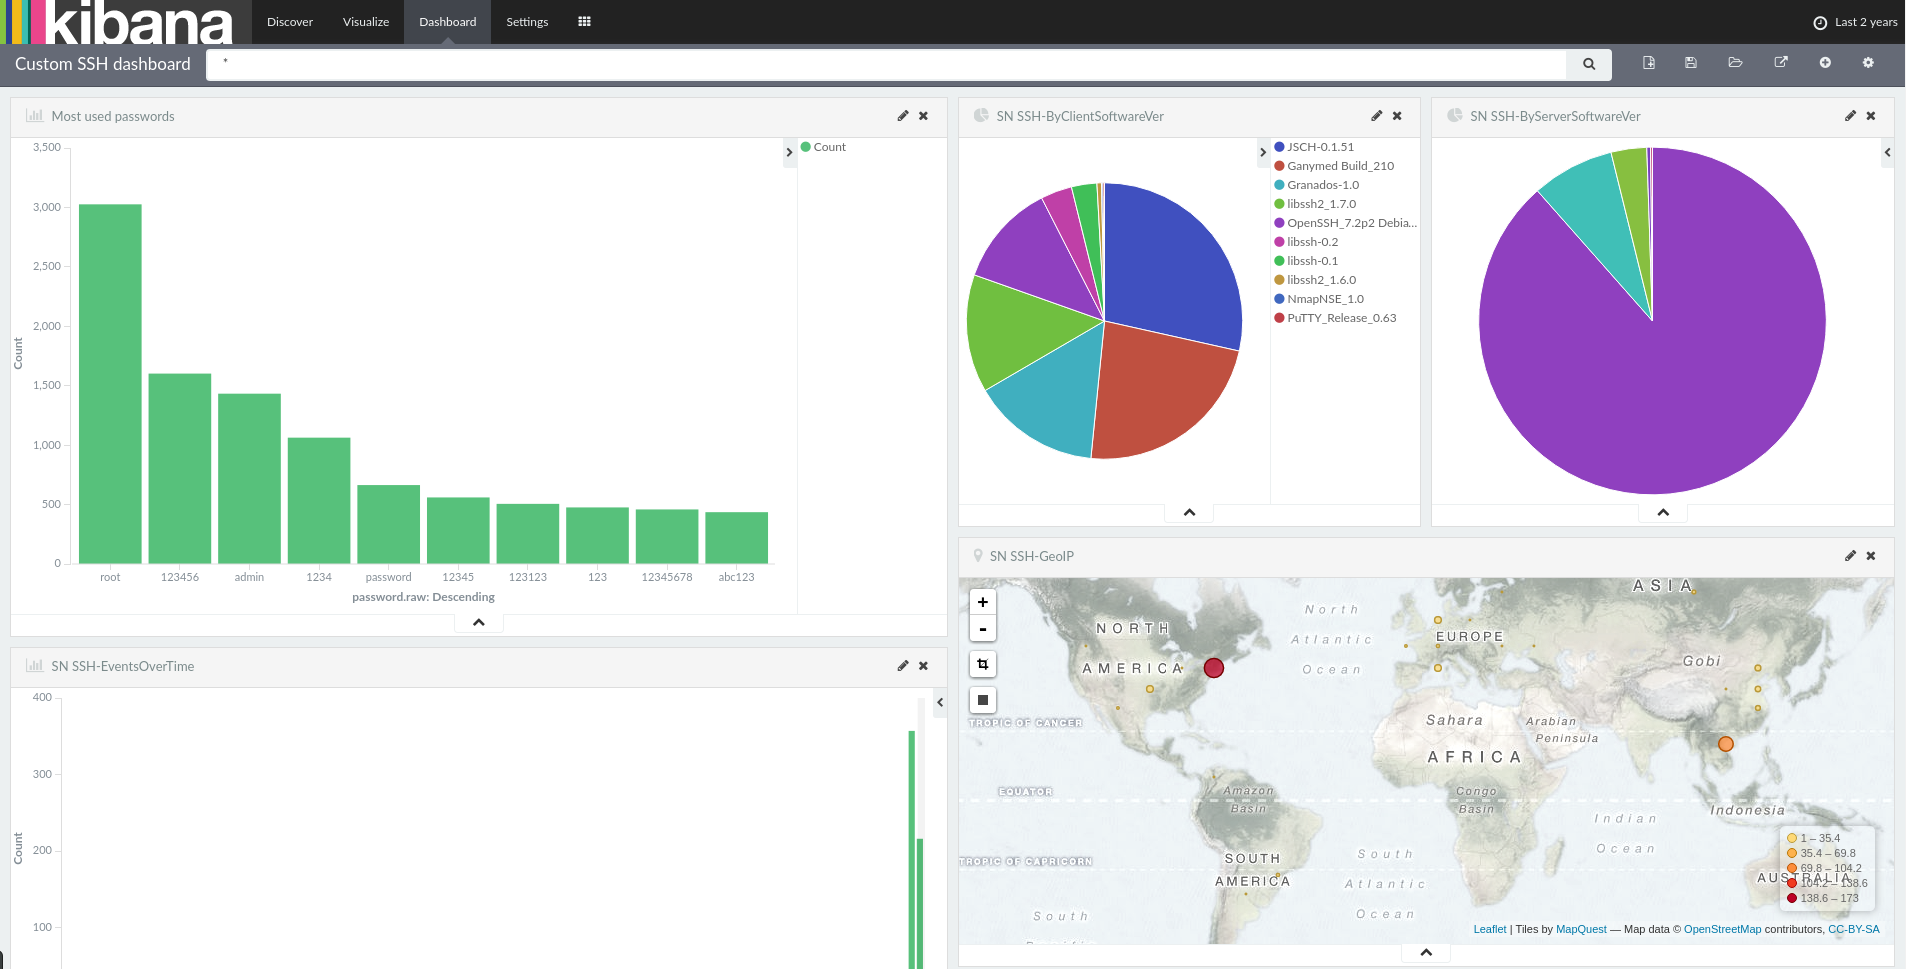
Once every containers are running, you can simply point your browser to https://localhost/ to start analyzing the traffic and fine tune the system. Kibana is coming with a set of predefined dashboards so you don't have to build your own before starting to work.
Amsterdam offers you really easy upgrade via integrated commands:
amsterdam -d ams upgrade
amsterdam -d ams restart
Amsterdam is multi instances. For example, let's say you have two customers where you analyzed the traffic when on site. You can set up two instances:
amsterdam -d customer1 -i wlan0 setup
amsterdam -d customer2 -i eth0 setup
and start the first one when at customer 1
amsterdam -d customer1 start
and second one when at customer 2
amsterdam -d customer2 start
The two different instances are not sharing any data, so you can freely show the interface to any of the customer if running the good instance. All data and configuration files are in customer1 directory for first customer and customer2 for the second one.
Amsterdam can digest any JSON formatted data. For that is is enough to copy a file to analyzed in the suricata directory inside the instance:
cp /path/to/passwords.json customer1/suricata/
This method makes it really easy to combine different sources of information into Kibana dashboards:
Amsterdam is also really easy to tune. The configuration files are stored for each components in the config directory so you can easily update Suricata, Logstash or Nginx configuration.
Stamus Networks is really excited by this first stable release of Amsterdam and we think that it has never been so easy to sniff and understand your network.
This release is dedicated to the memory of Edith Leblond.