After some hard team work, Stamus Networks is proud to announce the availability of SELKS 3.0RC1.
SELKS is both Live and installable Network Security Management ISO based on Debian implementing and focusing on a complete and ready to use Suricata IDS/IPS ecosystem with its own graphic rule manager. Stamus Networks is a proud member of the Open Source community and SELKS is released under GPLv3 license.
This is a the release candidate of a new major branch with an updated storage visualization stack and latest Suricata.
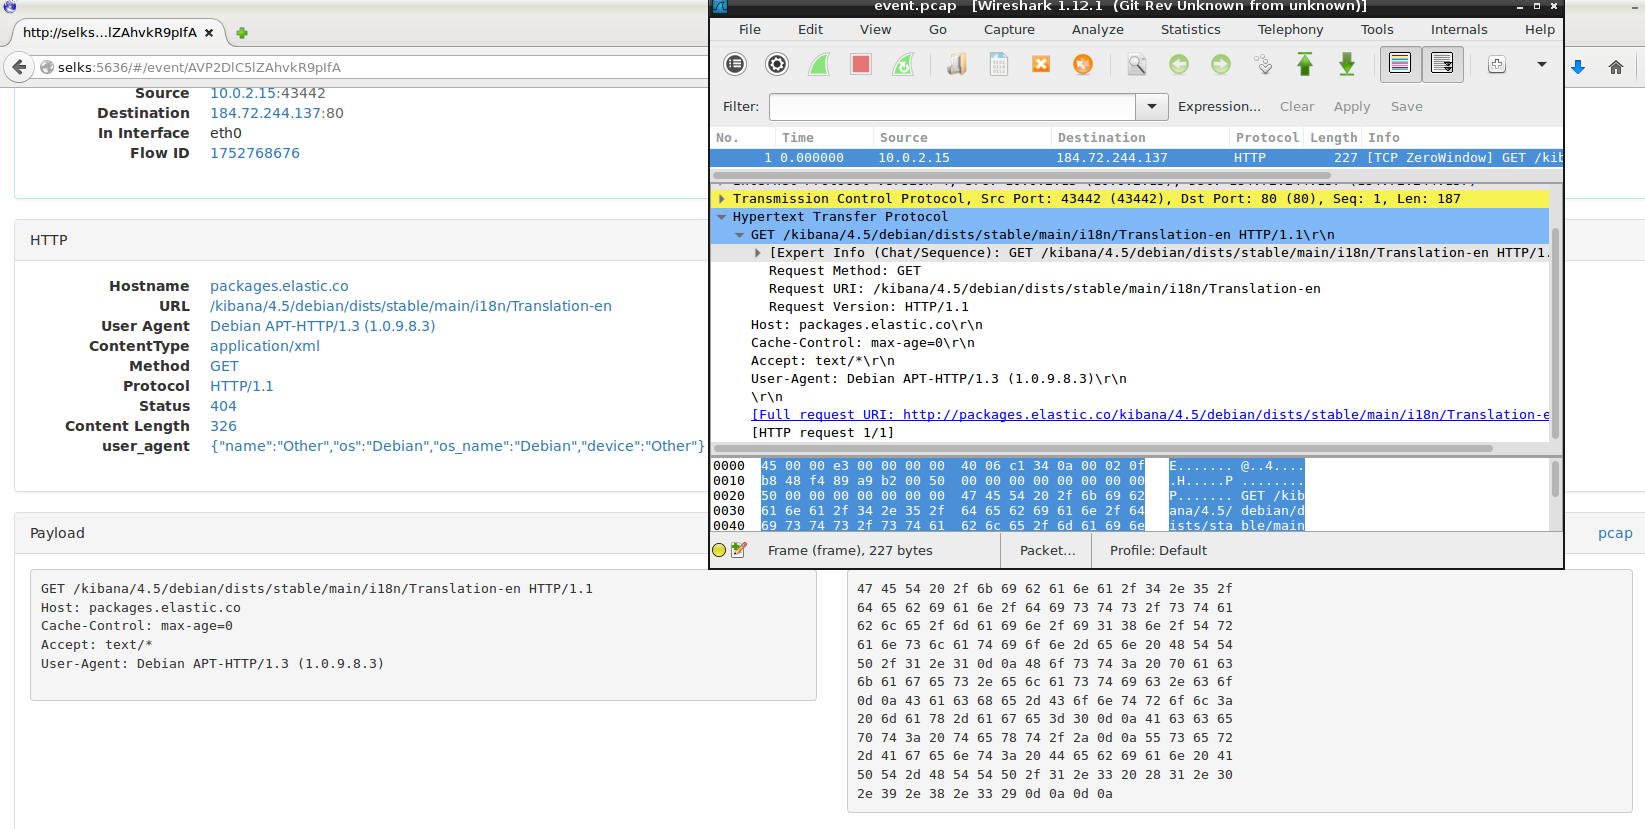
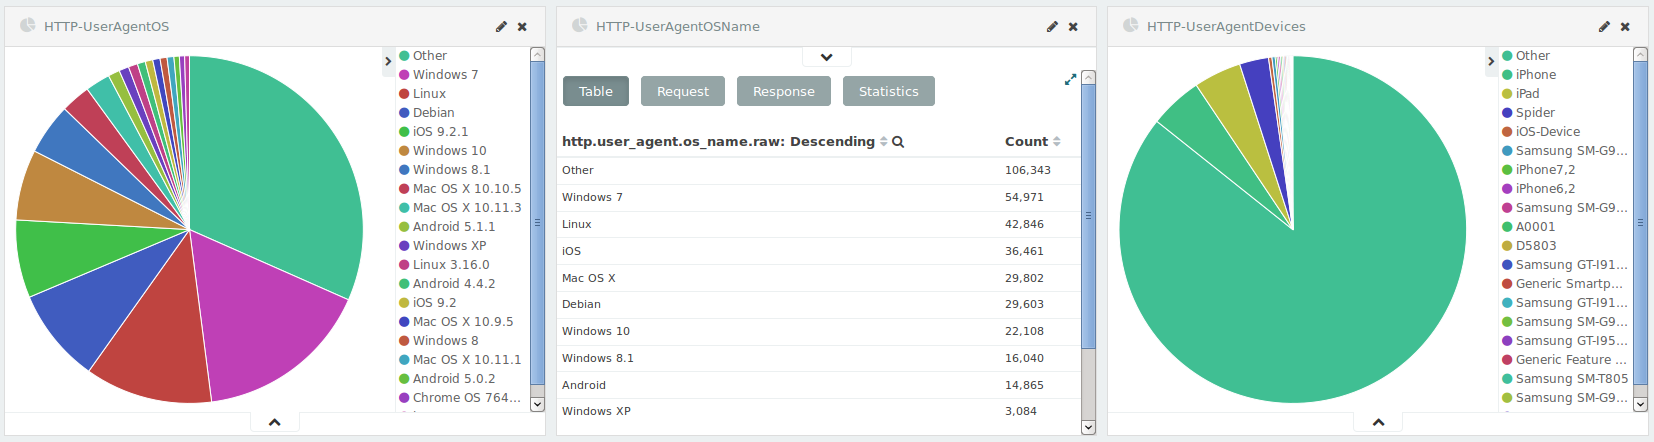
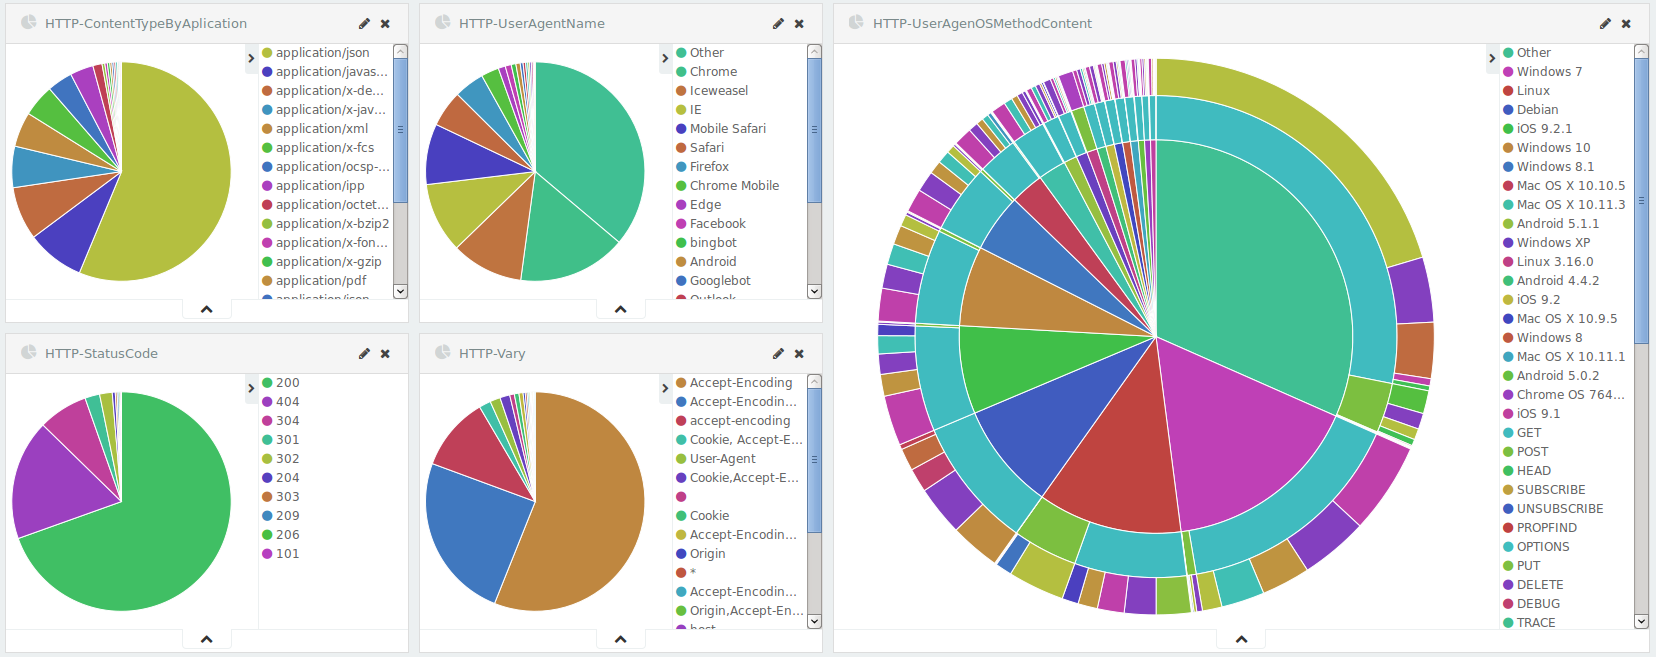
SELKS comes with 11 ready to use Kibana dashboards using more than 190 visualisations.
Please feel free to try it out, spread the word, feedback and let's talk about SELKS 3.0.
To get you started (the download link is below this paragraph):
Once installed in order to upgrade all components follow the guide here.
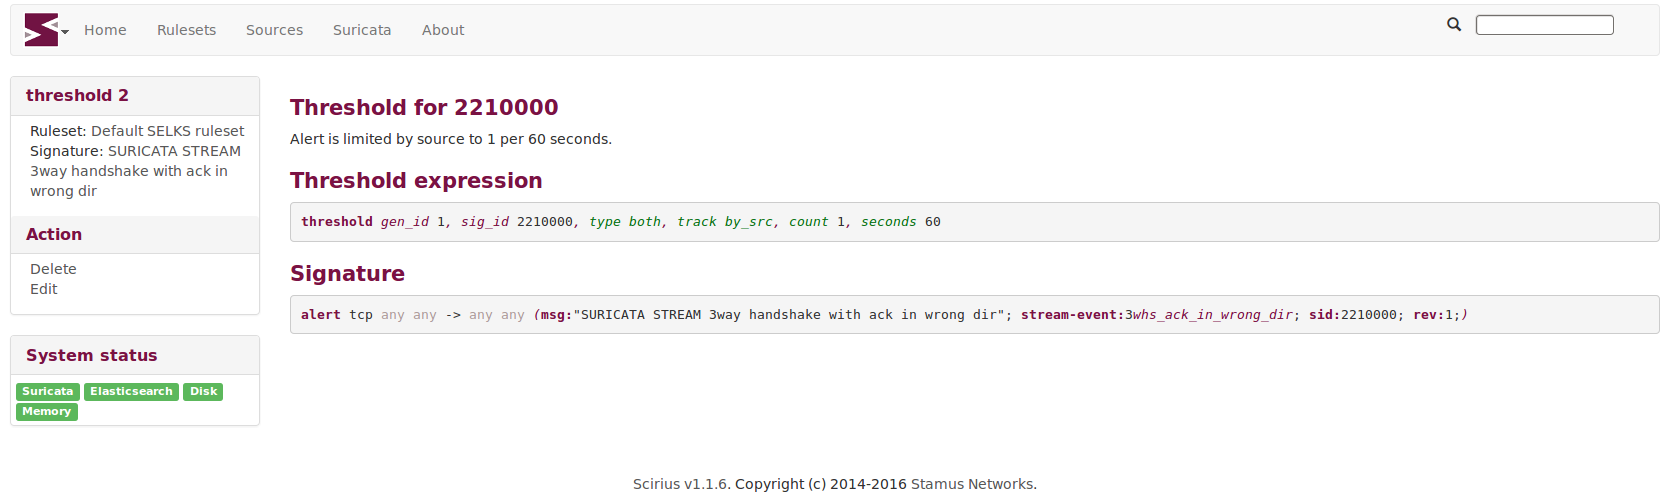
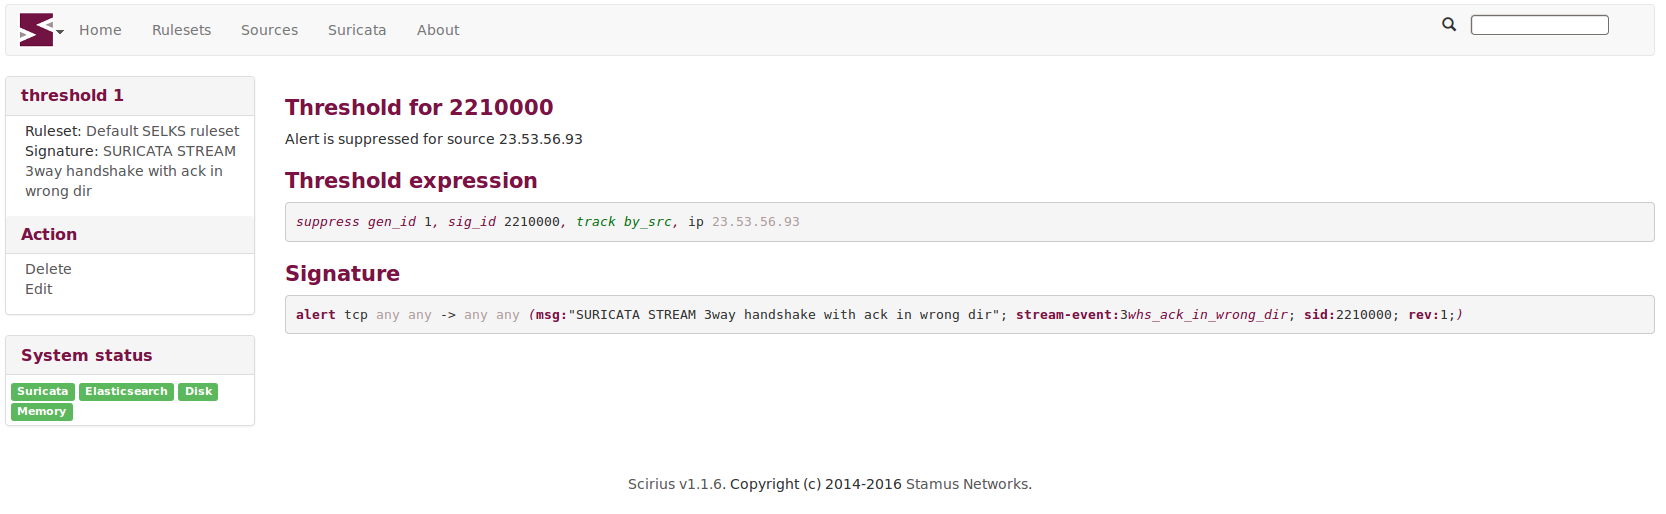
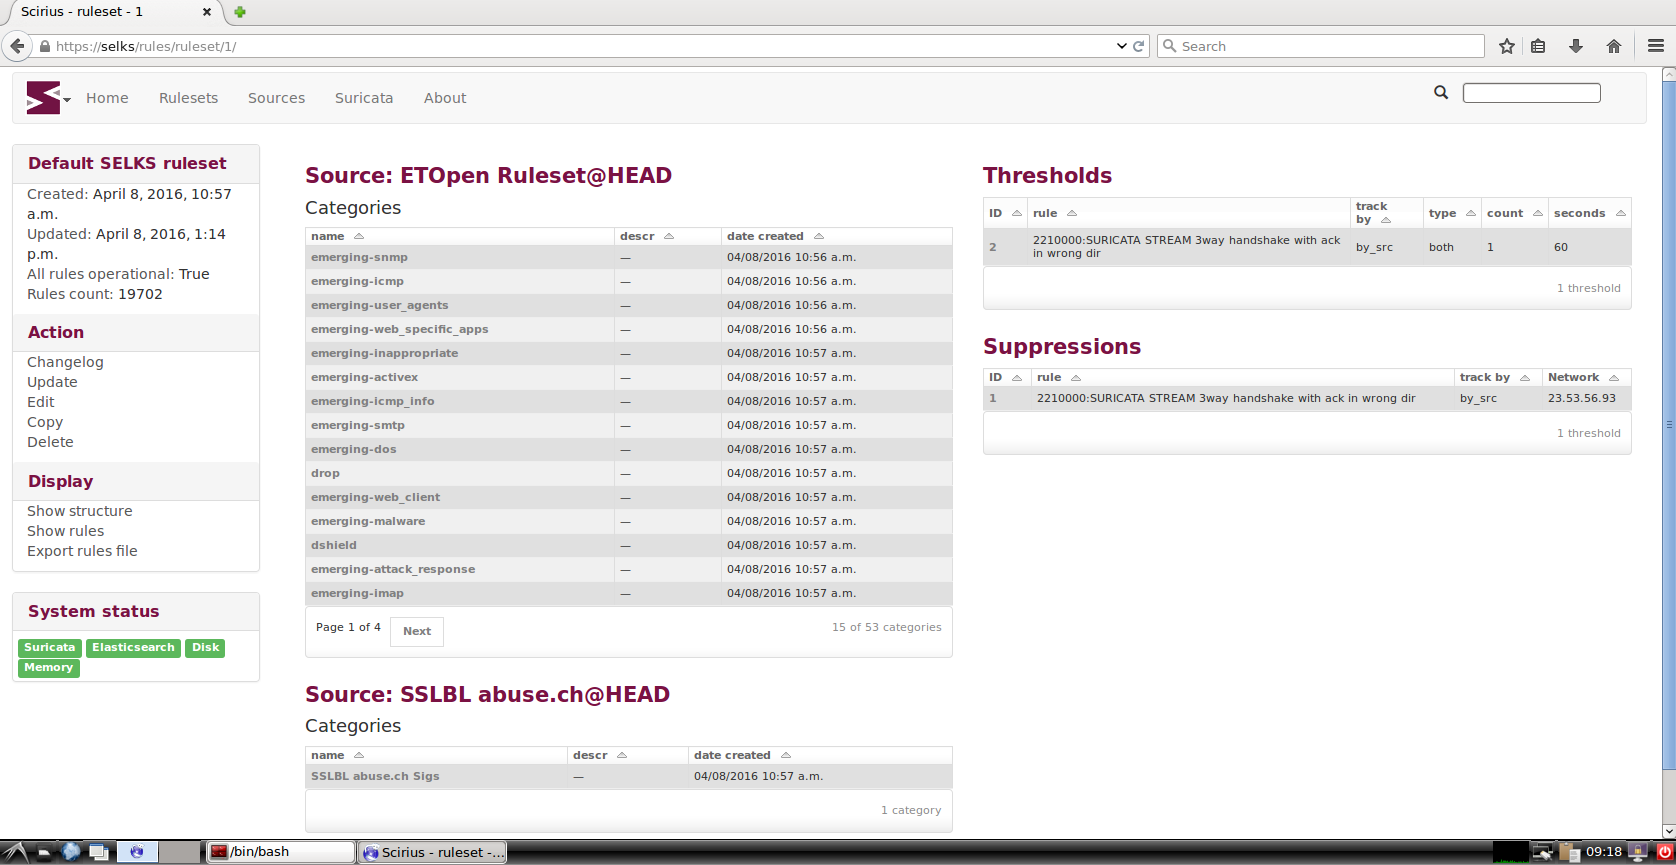
Usage and logon credentials (OS user) - user: selks-user, password: selks-user (password in Live mode is live). The default root password is - StamusNetworks
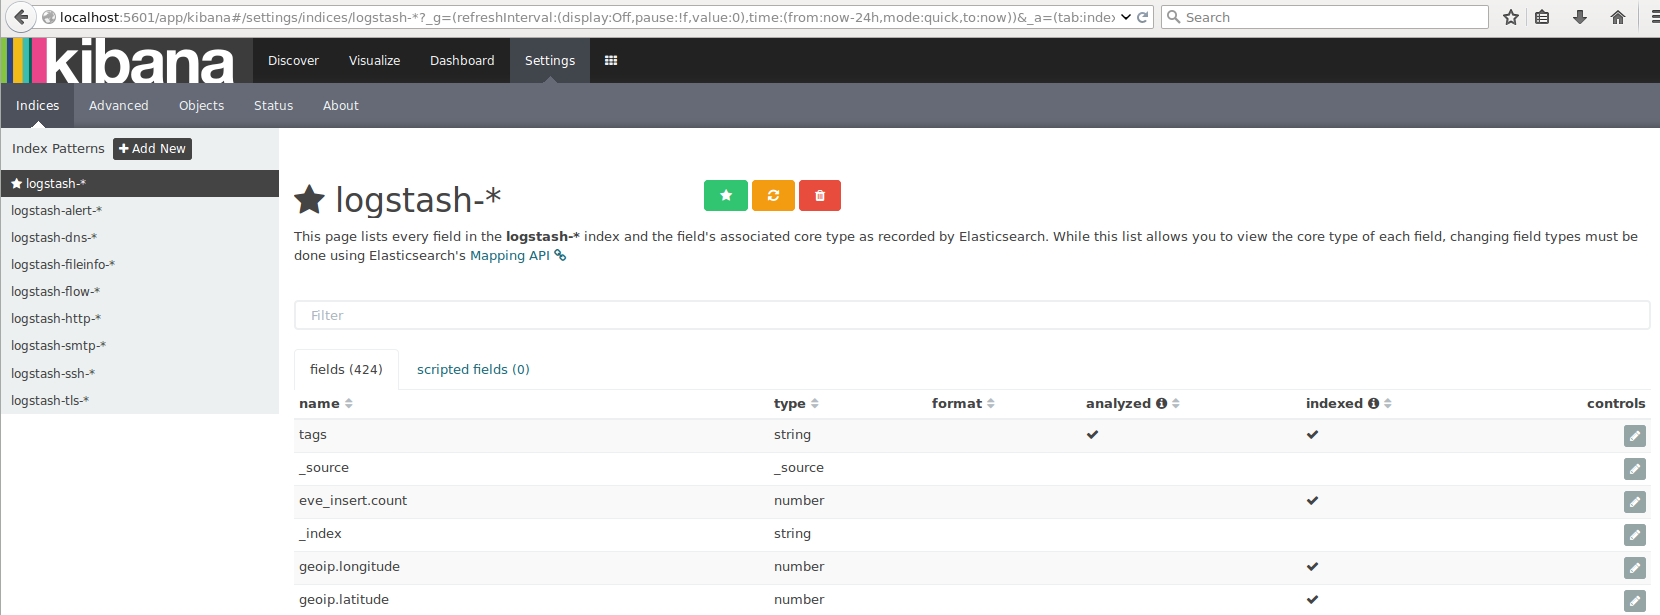
Upon log in double click the Scirius icon on the desktop. Credentials are - user: selks-user, password: selks-user. In the left upper corner click the drop down menu and choose "ALL" dashboards. Choose default index(click on logstash-* and then the green star) as depicted below. Then choose "Dashboards" and choose your desired dashboards from the 11 available.