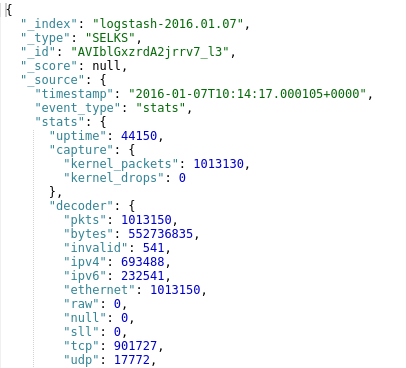
Suricata 3.0 will come with a lot of improvements on the output side. One of them is the ability to output Suricata internal statistics in the EVE JSON format.
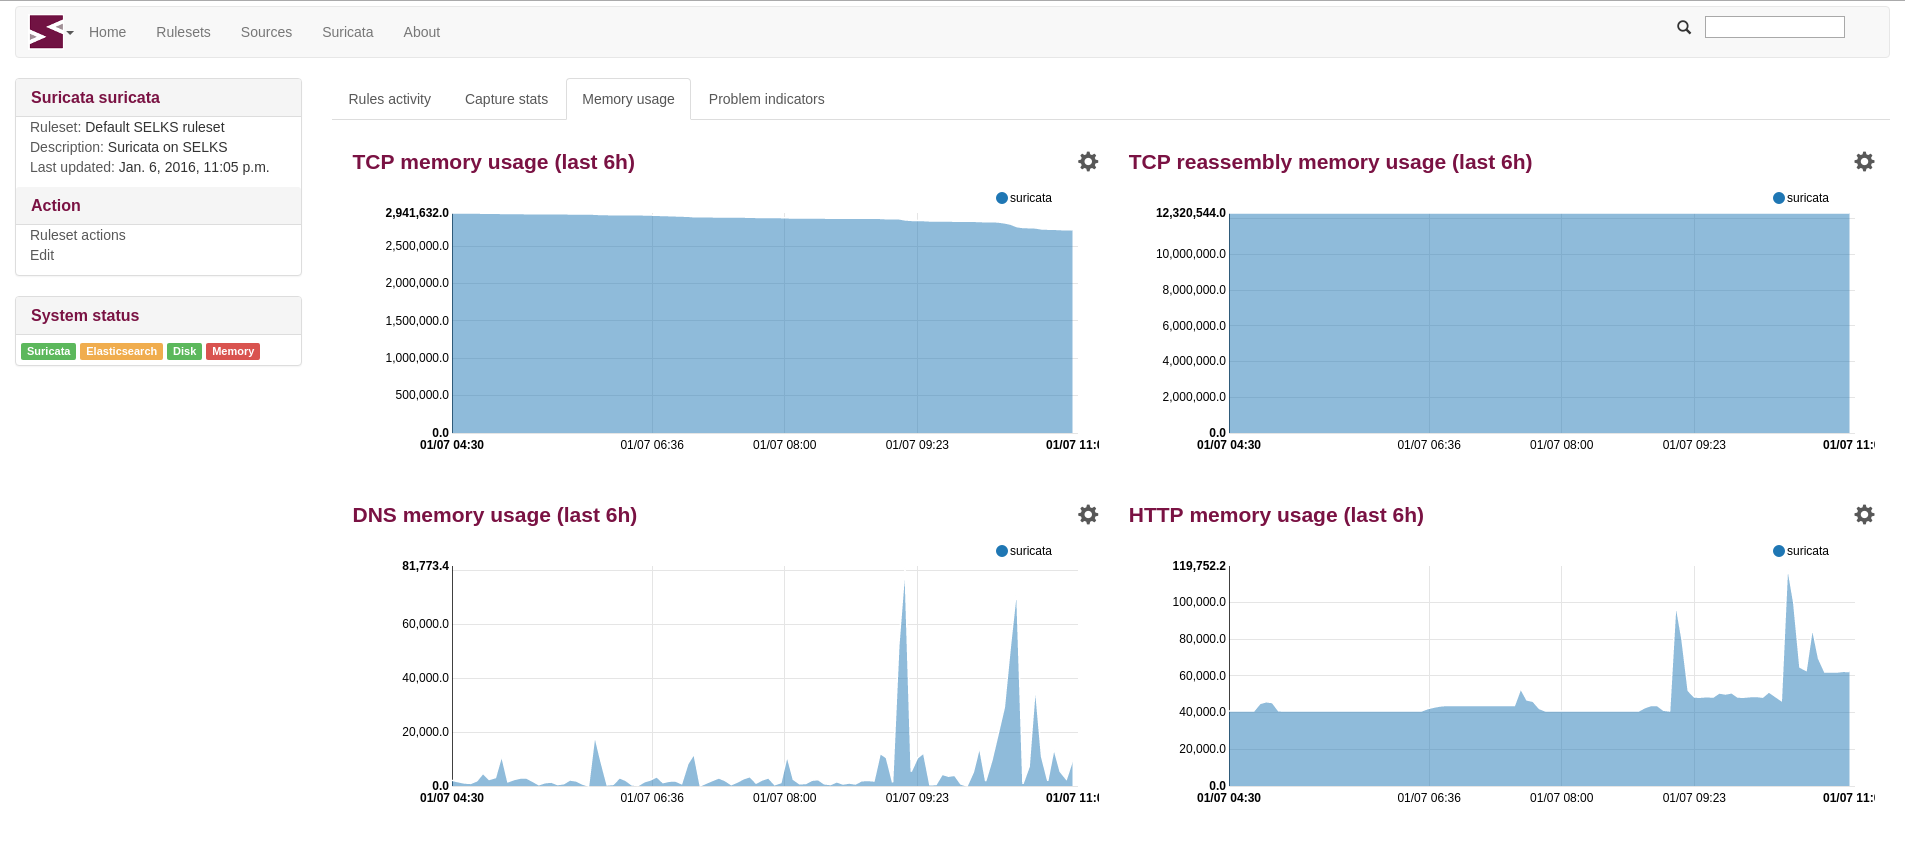
This functionality is already used by scirius to display statistics graphs of the Suricata running in SELKS, Amsterdam or Stamus Networks' appliances:
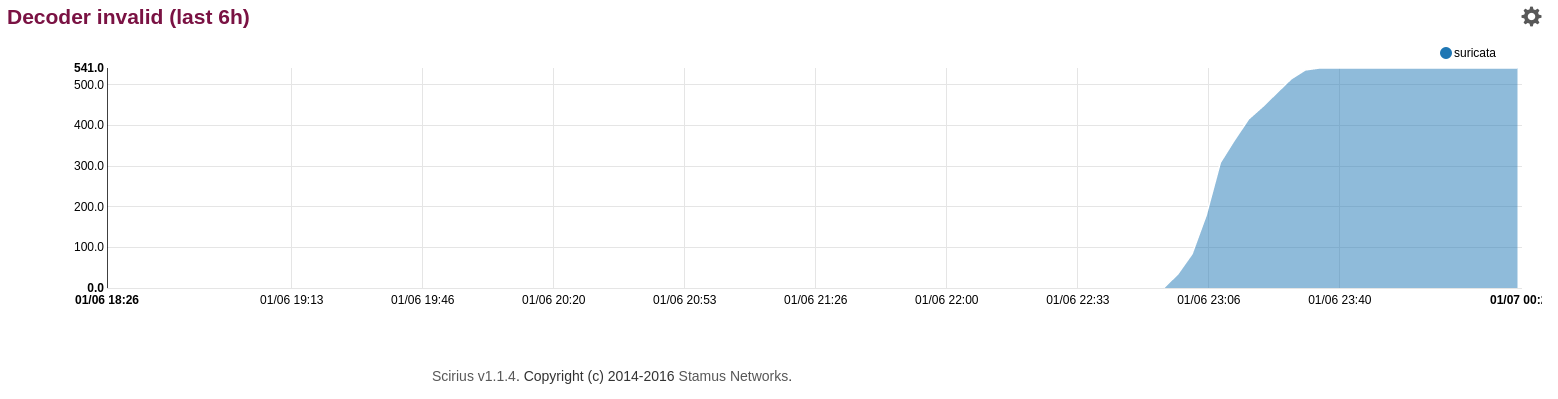
This statistic sometimes help to visualize the impact of configuration change. For example, in the next screenshot the generic receive offloading on the capture interface has been disable at 23:33:
Impact is cristal clear as the counter of invalid decoding did stop increasing.
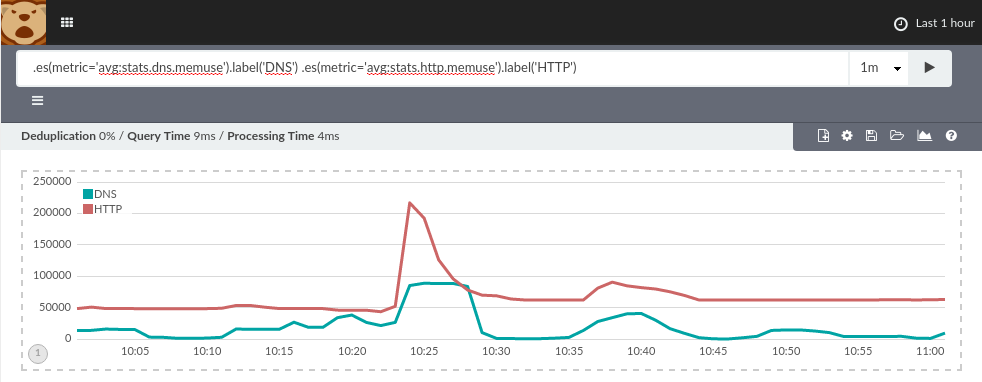
Amsterdam came with Kibana 4 and the Timelion plugin is preinstalled. Timelion is a plugin providing a new interface and language to graph timeline.
As Suricata stats data are fed into Elasticsearch, we can use it to graph Suricata performance data.
For example to graph DNS and HTTP memory usage, one can use the following syntax:
.es(metric='avg:stats.dns.memuse').label('DNS') .es(metric='avg:stats.http.memuse').label('HTTP')
Result is the following graph:
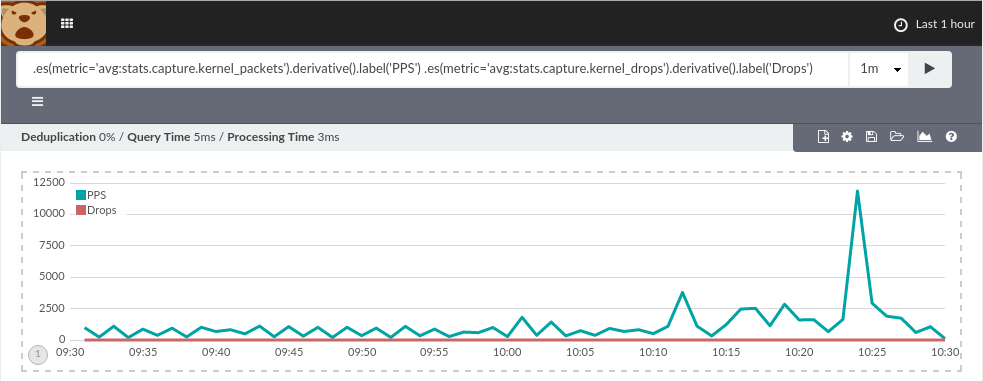
If you have a counter and want to graph rate, then you can use:
.es(metric='avg:stats.capture.kernel_packets').derivative().label('PPS') .es(metric='avg:stats.capture.kernel_drops').derivative().label('Drops')
And you get the following graph:
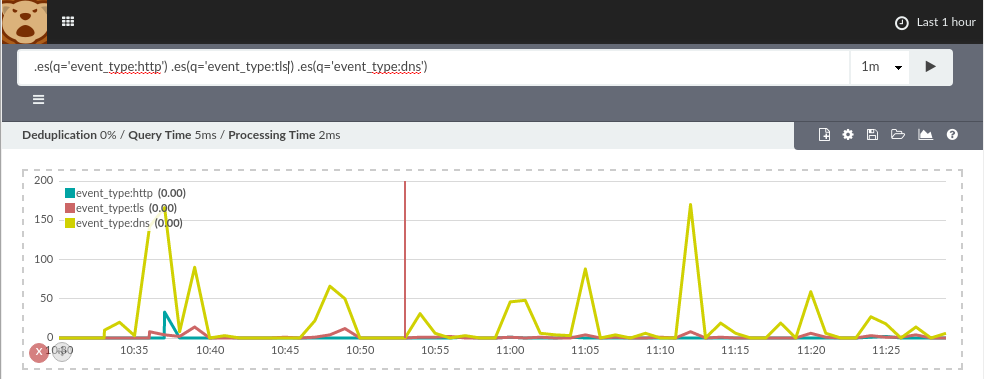
One interesting thing with Timelion is that you can use Lucene query to get a count of something really easily. For example to get a view on the rate of different event type, one can use:
.es(q='event_type:http') .es(q='event_type:tls') .es(q='event_type:dns')
Both method can be mixed so, if you have different probes (let's say probe-1 and probe-2) you can do something like:
.es(q='host.raw:"probe-1"', metric='avg:stats.dns.memuse').label('Probe-1 DNS') .es(q='host.raw:"probe-2"', metric='avg:stats.dns.memuse').label('Probe-2 DNS')
The new Suricata statistic output is really improving the information we can use when doing performance analysis. Combined with timelion, we get a really easy and powerful solution. If you want to give a try to all these technologies one of the easiest way is to use Amsterdam which comes with latest Suricata and a pre installed timelion.